November 17,2026 @01:14 PM
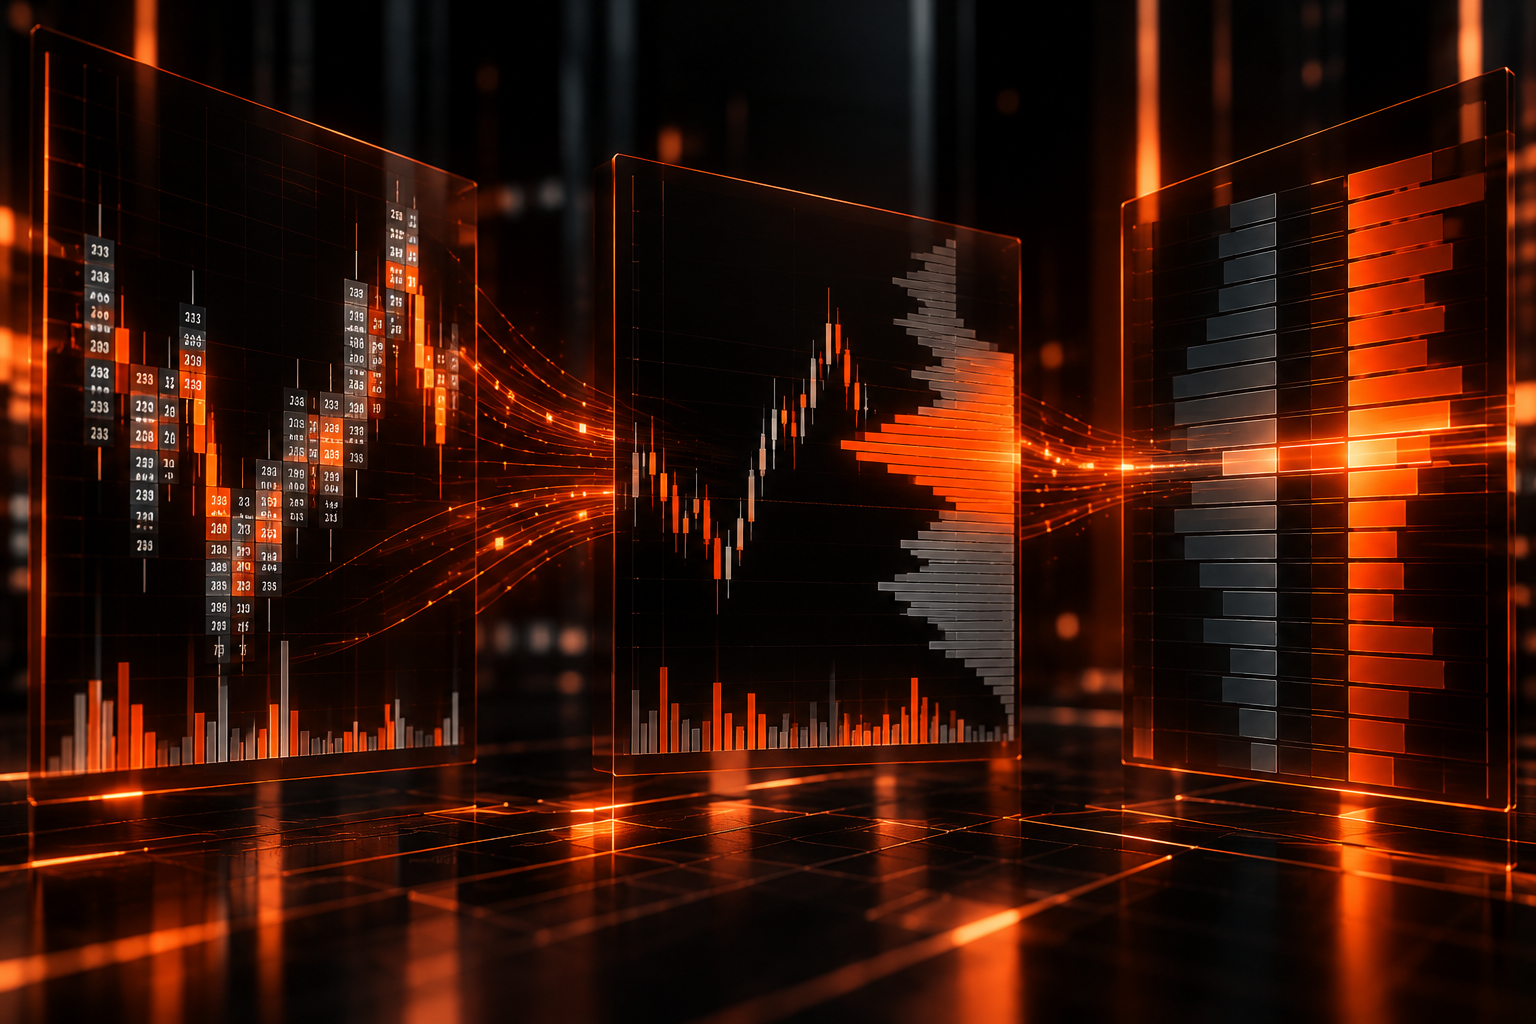
Footprint charts, Volume Profile, and the Depth of Market (DOM) are tools used by futures traders to examine different aspects of market activity. Although they may appear together in advanced trading platforms, they do not display the same information or answer the same questions.
The main difference is what each tool helps you observe:
- Footprint charts display trading activity at individual price levels within a bar, often separating volume executed at the bid and ask.
- Volume Profile organizes traded volume by price over a selected period or range.
- The Depth of Market (DOM) displays available resting buy and sell orders at different price levels, subject to the market data and feed being used.
Understanding these distinctions can help traders evaluate which tools fit their analysis process. None of them independently establishes where the market will move next, and the information they display should be interpreted in context.
Footprint Charts vs. Volume Profile vs. DOM: Quick Comparison
| Feature | Footprint Charts | Volume Profile | Depth of Market (DOM) |
| Primary focus | Executed trading activity at individual price levels within bars | Distribution of traded volume across price levels | Displayed resting buy and sell orders |
| Main data | Commonly bid/ask volume or other trade-level classifications | Volume grouped by price | Available bid and ask orders by price |
| Typical visual format | Numbers or values inside price bars | Horizontal volume histogram | Price ladder with bid and ask quantities |
| Main analytical question | Where and how was trading executed within a bar? | At which prices did the most trading occur during the selected range? | What orders are currently displayed at different prices? |
| Time perspective | Usually organized by bar or another selected interval | Selected session, period, or custom range | Continuously updating order book |
| Important limitation | Classification and interpretation depend on data and settings | Results depend on the selected range and profile settings | Displayed liquidity can change, and visible orders do not represent all future activity |
Features and terminology vary by platform, data feed, configuration, and market. The table describes common implementations rather than a universal specification.
1. What Is a Footprint Chart?
A footprint chart is a type of chart that displays trading activity at individual price levels within a bar. Depending on the platform and configuration, it can show bid volume, ask volume, total volume, trade counts, or other measures.
Traditional candlestick charts summarize the open, high, low, and close over an interval. Footprint charts add more granular information about activity at prices traded during that interval.
What information does a footprint chart show?
Common footprint chart implementations include:
- Bid and ask volume: Volume classified according to whether trades executed at the bid or ask.
- Volume at price: The amount of trading activity associated with each displayed price level.
- Imbalances: Differences between values on adjacent or corresponding bid and ask levels, according to the platform’s calculation method.
- Bar-level activity: How executed volume was distributed across the prices reached during a bar.
The available measurements depend on the platform, data feed, and selected chart settings. Traders should understand how their software defines and calculates each metric before relying on it.
What is a footprint chart used for?
Footprint charts can help traders examine how executed trading activity was distributed within a bar. For example, a trader might investigate whether activity was concentrated near the high or low of a bar, whether bid/ask volume differed across nearby price levels, or whether a particular area experienced unusually high activity relative to a chosen comparison.
These observations are descriptive. An apparent imbalance or concentration of volume does not, by itself, establish the cause of the activity or predict the next price movement.
Footprint chart limitations
Footprint charts can contain a substantial amount of information, and their interpretation depends on the quality and granularity of the underlying data. Different platforms may classify or display trades differently.
A footprint should therefore be evaluated alongside the broader market context, the selected time interval, and the trader’s analytical method. More granular information does not automatically mean more reliable decisions.
2. What Is Volume Profile?
Volume Profile displays traded volume across price levels for a selected session, period, or custom range. While a conventional volume histogram arranges volume over time, this tool displays how much volume traders bought and sold at each price level within the selected range.
The result is typically a horizontal histogram positioned alongside the price chart.
What information does Volume Profile show?
Depending on the platform, a Volume Profile may identify:
- Point of Control (POC): The price level with the greatest traded volume in the selected profile, according to the platform’s calculation.
- Value Area: A price range containing a configured proportion of the profile’s volume, commonly 70% when the default setting is used.
- High-volume areas: Price levels or zones where comparatively large amounts of volume were traded.
- Low-volume areas: Price levels or zones where comparatively little volume was traded.
Definitions, calculation methods, and display conventions can vary by platform. For example, traders can configure the Value Area percentage in many implementations, so you should not assume it stays identical across every chart.
What is Volume Profile used for?
Volume Profile can help traders study the distribution of trading activity across prices over a defined range. Traders can use it to examine where activity concentrated, compare sessions, or establish reference areas for further analysis.
The interpretation depends on the period selected. A session profile and a profile covering several weeks may tell different descriptive stories because they summarize different sets of trades.
High volume at a price does not guarantee that price will remain there, and low volume does not guarantee that price will move quickly through that area. These are analytical observations, not deterministic rules.
Volume Profile limitations
Volume Profile summarizes activity over a chosen range. It does not, by itself, show every individual execution or provide a complete picture of current resting orders.
Its usefulness depends on consistent settings, a clearly defined period, and an understanding of what the underlying data includes. Comparing profiles built with different ranges or settings can lead to misleading conclusions.
3. What Is the Depth of Market (DOM)?
The Depth of Market, commonly called the DOM or price ladder, displays available buy and sell orders at different price levels. In a typical futures trading interface, it presents bids on one side and asks on the other, alongside prices and order quantities.
Unlike a footprint chart or Volume Profile, which commonly focus on executed trading activity, the DOM focuses on displayed resting orders available in the order book.
What information does the DOM show?
Depending on the platform and market data feed, a DOM may display:
- Bid and ask prices.
- Quantities of displayed resting orders at each price.
- Displayed quantities change as traders add, modify, or remove orders.
- Order-entry and order-management controls, if supported by the platform.
- Additional depth or order-book information when the data feed and platform provide it.
The depth available to the trader depends on the exchange, feed, permissions, and software configuration. You should not expect a display to reveal every order or every source of potential liquidity.
How can you use the DOM in your trading?
Traders may use the DOM to monitor displayed order-book conditions and, where supported, manage order placement and execution workflows. Some traders examine changes in displayed liquidity alongside executed trades and price movement.
However, displayed orders can change or be cancelled before execution. The DOM does not guarantee visible liquidity, nor does a displayed quantity prove future buying or selling pressure.
DOM limitations
The DOM is a view of available order-book information, not a complete forecast of market direction. Its detail and update behavior depend on the data feed and platform.
Traders should also distinguish between displayed resting orders and completed transactions. The presence of an order does not mean that it will execute, and changes in displayed depth do not independently establish the intent of market participants.
4. The Core Difference: Executed Trades vs. Volume Distribution vs. Resting Orders
The most useful way to distinguish these tools is to consider the type of information each one organizes.
Footprint charts: How trading occurred within a bar
Footprint charts provide a more granular view of executed activity at prices within a bar. They are useful when the analytical question concerns the distribution or classification of trading activity inside that interval.
Volume Profile: Where trading activity accumulated
Volume Profile groups traded volume by price across a selected range. It is useful when the question concerns the distribution of activity across a session or another defined period.
DOM: Displays active orders in the order book
The DOM presents available resting orders at different prices, subject to the depth and data provided. It is useful when the question concerns the displayed state of the order book or the management of orders.
These tools can complement one another, but they are not interchangeable. A profile of completed trades does not provide the same information as a live view of resting orders, and neither replaces the more granular execution view that a footprint chart may provide.
5. Can You Combine Footprint Charts, Volume Profile, and DOM?
Yes. Some futures traders use all three as different views of market activity. Whether that combination is useful depends on the trader’s objectives, experience, data access, and analytical process.
For example, an analytical workflow might involve:
- Reviewing a Volume Profile to see how traders distributed volume across a selected session or range.
- Examining footprint bars to see how buyers and sellers executed trades at specific prices.
- Observing the DOM to review currently displayed resting orders, where the available data supports that analysis.
This is an illustrative workflow, not a prescribed trading strategy. The tools can show different information, and their signals may not agree. Additional indicators or more detailed data do not guarantee better outcomes.
A trader should evaluate whether each tool contributes distinct, understandable information or simply adds complexity to the workflow.
6. Which Tool Should You Evaluate for Your Trading Workflow?
There is no universally appropriate choice. Your analytical questions and platform features determine the most relevant tool.
| If your main question is… | A tool to evaluate | What to verify |
| How was executed volume distributed across prices within a bar? | Footprint charts | Bid/ask classification, available metrics, data granularity, and configuration |
| At which prices was volume concentrated over a selected period? | Volume Profile | Profile range, volume calculations, Point of Control, and Value Area settings |
| What resting orders are displayed at different price levels? | DOM | Available market depth, feed permissions, update behavior, and order-entry features |
These categories are starting points for evaluating functionality, not recommendations to trade a particular way. Some platforms combine all three tools, while others provide only a subset or implement them differently.
When evaluating software, consider the available data, platform compatibility, costs, technical requirements, ease of use, and whether the tools fit your existing process. Confirm the current specifications with the platform provider before making a decision.
7. How Do You Choose a Futures Trading Platform for These Tools?
The presence of a footprint chart, Volume Profile, or DOM is only one part of a platform evaluation. Traders may also need to consider:
- Data availability: Which exchanges, instruments, and market depth levels does the platform support?
- Calculation and display settings: Can you configure the relevant metrics and profile ranges to fit your needs?
- Order management: Does the platform support the order types and controls required for the intended workflow?
- Compatibility: Are the platform, operating system, data feed, and brokerage arrangements compatible?
- Costs: What are the applicable software, data, exchange, and other fees?
- Learning requirements: Can the trader easily understand and verify how the system calculates the displayed information?
- Operational requirements: What connectivity, hardware, permissions, and support arrangements do you need?
Availability and cost can change, so confirm current details directly with the relevant providers. A longer feature list does not automatically make a platform more suitable for an individual trader.
EdgeClear’s Trading platform directory is a starting point for exploring supported platform options. Product pages such as EdgeProX and VolSys can be reviewed for their stated features and compatibility. Verify current product details before relying on them.
Frequently Asked Questions
Is a footprint chart the same as Volume Profile?
No. A footprint chart commonly displays executed trading activity at price levels within individual bars. Volume Profile groups traded volume by price across a selected period or range. Both can describe trading activity, but they organize it differently.
Is the DOM the same as order flow?
Not exactly. The DOM displays resting orders available in the order book, while the term order flow can refer more broadly to the study of buying and selling activity, including executed trades and changes in available liquidity. Usage of the term varies by trader and platform.
Does Volume Profile show buying and selling pressure?
Volume Profile primarily displays how traders distribute volume across prices. By itself, it does not necessarily separate buying and selling in a way that establishes directional pressure. You may need additional data and tools to perform other forms of analysis.
Does a footprint chart show every order in the market?
Not necessarily. Footprint charts typically organize executed trading activity according to the data and classification methods available to the platform. Footprint charts show executed trades, not a complete record of all resting orders.
Can the DOM predict where the market will move next?
The DOM does not reliably predict future price movement on its own. Traders can change or cancel displayed orders, and the visible book may not show all available liquidity. It provides information about displayed order-book conditions, not certainty about future outcomes.
Do I need all three tools to trade futures?
No single combination is appropriate for everyone. The relevant tools depend on the trader’s objectives, experience, analytical approach, data access, and platform requirements. Traders should understand each tool’s limitations before incorporating it into a workflow.
Are footprint charts, Volume Profile, and DOM available on every futures platform?
No. Availability varies by platform, data feed, subscription, instrument, and configuration. Confirm the current feature set, compatibility, and any associated costs with the relevant provider.
Final Takeaway
Footprint charts, Volume Profile, and the DOM provide different views of futures market activity. Footprint charts commonly organize executed activity within bars, Volume Profile summarizes traded volume across prices, and the DOM displays resting orders in the order book.
Understanding the distinction can help traders evaluate tools based on the information they actually provide rather than treating them as interchangeable indicators. The right platform and configuration depend on the trader’s needs, and none of these tools guarantees a particular trading outcome.
This article is for educational and informational purposes only. It is not investment advice, a recommendation to buy or sell any financial instrument, or a guarantee of trading results. Futures trading involves substantial risk and may not be suitable for every trader.
Featured Posts
November 17, 2026
Footprint Charts vs. Volume Profile vs. DOM: Key Differences for Futures Traders
November 13, 2026
How to Choose an Order Flow Platform for Futures Trading?
November 13, 2026
What Is Order Flow Trading? A Practical Guide for Futures Traders
November 6, 2026
A Day in the Life of a Futures Broker