November 13,2026 @08:03 AM
What Is Order Flow Trading?
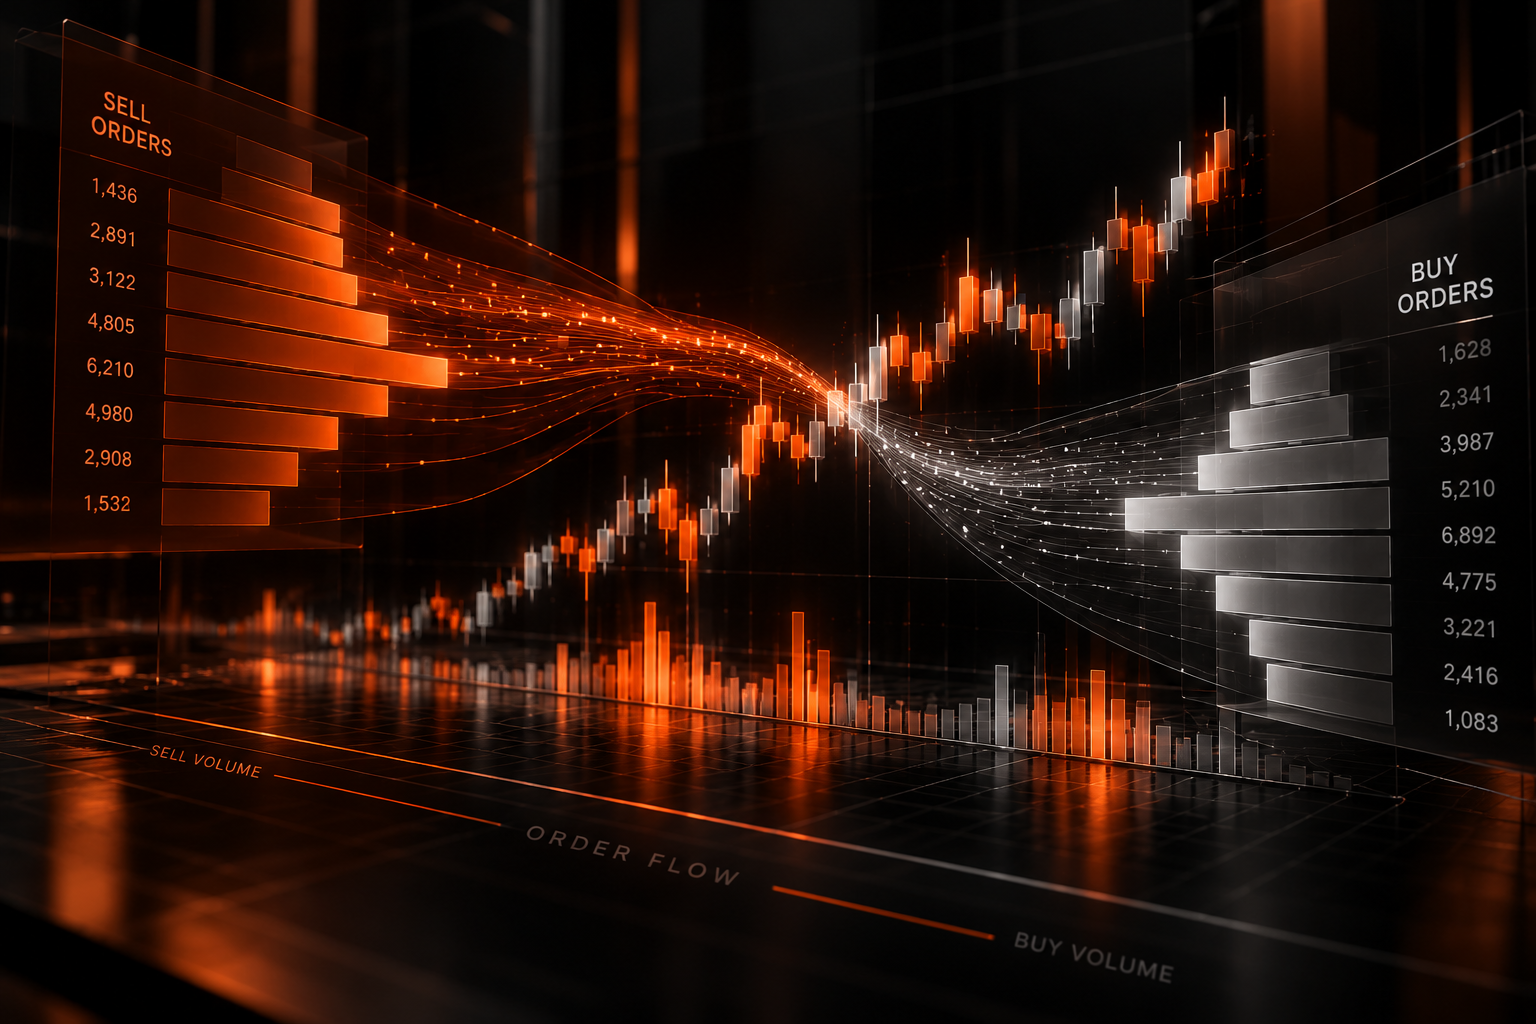
Order flow trading is an approach to market analysis that examines trading activity and available order-book information to understand how buying and selling interact at different price levels.
Instead of looking only at price charts or traditional technical indicators, traders who use order flow analysis may examine executed volume, bid and ask activity, and changes in market depth. The goal is to add context to price movements and better understand how transactions are taking place.
In futures markets, order flow tools can help traders examine questions such as:
- Where is trading activity concentrated?
- How much volume is being executed at the bid versus the ask?
- How is displayed liquidity changing as prices move?
- Is a price level attracting activity, or is trading moving through it quickly?
These observations can provide additional information about market behavior. They do not reveal every participant’s intentions, predict the next price movement with certainty, or guarantee a trading outcome.
In short: Order flow trading uses information about orders and executed trades to analyze market activity. It is a method of interpreting market data, not a standalone guarantee of better decisions or profitable trades.
How Does Order Flow Work in Futures Markets?
A futures market brings together buyers and sellers through an exchange’s trading system. Orders can be submitted, modified, canceled, matched, and executed according to the market’s rules.
Order flow analysis focuses on two related sources of information:
- Executed trades: Transactions that have actually taken place.
- Available order-book information: Displayed buy and sell orders waiting to be matched, subject to the data available from the market and feed.
Understanding the difference matters. An order displayed in the book is not the same as a completed trade. Displayed orders can change or be canceled, and the visible book does not necessarily show every form of trading interest.
The bid and the ask
The bid is the highest displayed price a buyer is currently willing to pay. The ask, also called the offer, is the lowest displayed price a seller is currently willing to accept.
When a buyer agrees to transact at an available ask price, the trade is commonly described as occurring at the ask. When a seller agrees to transact at an available bid price, the trade is commonly described as occurring at the bid.
Order flow tools can organize this activity by price and side, helping traders examine where transactions are occurring.
However, a higher volume of trades at the ask does not, by itself, establish that the market must move higher. Market conditions, liquidity, the orders that follow, and the broader context all matter.
Market orders and limit orders
A market order generally seeks execution against available liquidity, subject to market conditions and order-handling rules. Its execution price is not necessarily guaranteed, particularly when prices are moving quickly or available liquidity is limited.
A limit order specifies a price limit. It may add displayed liquidity when resting in the order book, but execution is not guaranteed: the market may never trade at the specified price, or the order may not be filled in full.
These distinctions help explain why order flow analysis considers both completed transactions and displayed orders. Neither source should be interpreted in isolation.
Four Order Flow Concepts Traders Should Understand
1. Volume at the bid and ask
Volume-at-bid and volume-at-ask tools categorize executed transactions according to how they occurred relative to the bid and ask.
Some traders compare these figures to investigate aggressive buying or selling activity. Differences between the two sides may help describe activity at a particular price or over a selected period.
But these figures have limitations. Classification depends on the data and methodology used, and the imbalance between bid and ask volume does not establish what will happen next.
2. Depth of Market (DOM)
The Depth of Market, often called the DOM or price ladder, displays available buy and sell orders at multiple price levels, depending on the market data provided.
Traders may use a DOM to examine:
- Displayed order quantities at different prices.
- Changes in displayed liquidity.
- The relationship between the best bid and ask.
- How the visible book changes as orders are added, modified, canceled, or executed.
A DOM is a view of available market information, not a complete picture of every participant’s intentions. Displayed liquidity can change quickly, and a large displayed quantity does not guarantee that price will reverse or remain at that level.
3. Footprint charts
Footprint charts organize trading information inside individual price bars. Depending on the platform and chart configuration, they can show volume executed at the bid and ask at different prices.
Traders use footprint charts to examine the distribution of activity within a bar rather than relying only on its opening, high, low, and closing prices.
For example, a trader might compare bid and ask volume near a bar’s high with activity in the middle of the bar. That comparison can help describe how trading activity differed across price levels.
A footprint chart is not a prediction engine. Its interpretation depends on the data, the chart settings, the instrument, and the market context.
4. Volume Profile
Volume Profile displays traded volume across price levels for a selected period or range. It differs from a conventional volume histogram, which typically displays volume across time-based bars.
Depending on the configuration, a Volume Profile may help traders identify:
- Price levels where more trading occurred during the selected range.
- Areas with comparatively lower traded volume.
- How the distribution of activity changes between sessions or periods.
These observations describe historical trading activity for the selected data and range. They do not establish that a price level will act as support or resistance in the future.
Order Flow vs. Traditional Technical Analysis
Order flow analysis and traditional technical analysis are not necessarily competing approaches. They examine different aspects of market behavior and may be used together.
| Approach | Main focus | Example question |
| Price action | Price movement and structure | How has price behaved around a previous high? |
| Technical indicators | Calculations derived from price, volume, or other data | How has momentum changed over a selected period? |
| Order flow analysis | Executed trades and available order-book information | How is trading activity distributed across prices? |
| Volume Profile | Traded volume by price level | At which prices did the most volume trade during this range? |
| DOM analysis | Displayed orders and changes in market depth | How is visible liquidity changing near the current market? |
The usefulness of each approach depends on the trader’s objectives, experience, data quality, and methodology. More information does not automatically mean better decisions; it can also introduce noise or encourage overinterpretation.
A Practical Example: Interpreting Order Flow at a Price Level
Imagine a futures contract approaching a price level that a trader has marked for observation.
The trader might use a price chart to identify the level, a footprint chart to review executed volume around it, and the DOM to observe displayed orders nearby.
The trader could then ask:
- What has actually traded? Review executed volume at the relevant prices.
- How is activity distributed? Compare bid and ask volume, while recognizing the limits of the classification.
- What is happening to displayed liquidity? Observe whether visible orders are changing, without assuming they will remain in place.
- What does price do next? Evaluate subsequent price movement rather than treating one reading as a definitive signal.
- What are the risks? Consider volatility, liquidity, transaction costs, potential slippage, and the possibility that the initial interpretation is wrong.
This is an illustration of an analytical process, not a trading setup or recommendation to buy or sell. The same observations can be interpreted differently, and market behavior can change rapidly.
What to Look for in an Order Flow Trading Platform
The right platform depends on the instruments traded, the information required, the trader’s workflow, and the available market data. Before choosing a platform, consider the following factors.
Data availability and quality
Check which exchange data, depth levels, and order-flow features are available for the instruments you trade. Data packages, exchange permissions, and platform configurations can affect what you can see.
Charting and analysis tools
Determine whether the platform supports the views you actually need, such as footprint charts, volume analysis, or other market-depth tools. Confirm the precise functionality rather than assuming every platform offers the same features.
Order-entry workflow
Review how orders are entered, modified, canceled, and monitored. Consider whether the interface fits your workflow and whether you understand the order types and controls it provides.
Connectivity and order routing
Understand how the platform connects to the relevant data and order-routing services. Availability, routing arrangements, and execution characteristics can depend on the broker, provider, exchange, account configuration, and market conditions.
Costs and requirements
Check platform fees, market data charges, exchange fees, commissions, and any other applicable costs. Also verify hardware, operating-system, connectivity, and account requirements before committing.
Learning curve and usability
A platform with many advanced features may also require more time to learn. Consider whether its layout, documentation, and available support match your experience and needs.
There is no single platform that is automatically right for every futures trader. Compare specific features, requirements, costs, and workflows before making a decision.
Exploring Order Flow Tools at EdgeClear
Traders researching order flow technology can explore the available platform information on EdgeClear’s website.
- EdgeProX: Review the platform’s published information to understand its available trading and analysis tools.
- VolSys: Explore the platform overview and its described market-analysis capabilities.
- CTS Data & Order Routing: Review the published information about data and order-routing services.
Features, compatibility, market data, costs, and account requirements can vary. Check the current product details and confirm any requirements with EdgeClear before making a decision.
Common Order Flow Trading Mistakes
Order flow data can be useful for describing market activity, but it is easy to draw conclusions that the data does not support.
Treating every imbalance as a signal. A difference between bid and ask volume is an observation, not proof that price will move in a particular direction.
Assuming displayed orders will remain available. Visible orders can be modified or canceled before execution. A displayed quantity should not be treated as a guaranteed barrier or destination for price.
Ignoring market context. The same pattern may appear under different volatility, liquidity, and trading-session conditions. A single chart reading does not provide the full context.
Using more tools without a clear process. Multiple indicators and data displays can create conflicting signals. Define what each tool is intended to help you understand.
Ignoring costs and execution risk. Commissions, exchange and data fees, spreads, and slippage can affect the economics of trading. A market-data display does not eliminate these costs or guarantee execution at a desired price.
Assuming past patterns will repeat. Historical observations do not establish that similar market behavior will produce similar future outcomes.
Frequently Asked Questions
Is order flow trading suitable for beginners?
Order flow analysis can have a steep learning curve because it involves understanding market data, order types, execution, and the limitations of displayed liquidity. Beginners should first understand how futures markets work and should not assume that advanced tools automatically improve trading outcomes.
Is order flow trading the same as Volume Profile?
No. Volume Profile displays traded volume across price levels for a selected range. Order flow is a broader approach that can include executed bid-and-ask volume, footprint charts, and order-book information.
What is the difference between a footprint chart and a DOM?
A footprint chart organizes executed trading information within price bars. A DOM displays available orders at multiple price levels, depending on the market data feed. One focuses on how transactions occurred; the other shows displayed liquidity and how it changes.
Does order flow predict market direction?
No. Order flow tools describe aspects of trading activity, but they cannot predict market direction with certainty. Their interpretation depends on context, data quality, and the trader’s methodology.
Do I need a special platform to analyze order flow?
The tools available depend on the platform and its data configuration. If you want to examine features such as footprint charts or detailed market depth, verify that the platform supports those features for your chosen instruments.
Can order flow analysis eliminate trading risk?
No. Order flow analysis does not eliminate market risk, execution risk, or the possibility of losses. Futures trading involves substantial risk and may not be suitable for everyone.
Final Thoughts
Order flow trading offers a way to examine executed transactions and available order-book information in greater detail. Concepts such as bid-and-ask volume, DOM, footprint charts, and Volume Profile can help traders describe market activity from different perspectives.
The important distinction is between observing market information and assuming that it guarantees a particular outcome. Order flow tools should be understood in context, used with a defined analytical process, and evaluated alongside the costs and risks of futures trading.
If you are comparing platforms, start with the data and tools you need, verify the published features and requirements, and choose a workflow you can understand and evaluate consistently.
Risk disclosure: Futures trading involves substantial risk and is not suitable for every investor. You could lose more than your initial investment. This article is for educational and informational purposes only; it is not investment advice, a recommendation to trade, or a guarantee of results. Consider your financial circumstances and seek appropriate professional guidance before trading.