Annoucements

Latest videos
Learn More
Understanding Capital Preservation | EdgeShorts: Futures, Fast & Simple
Crush Spreads in Futures | EdgeShorts: Futures, Fast & Simple
Understanding the OHLC Indicator | EdgeShorts: Futures, Fast & Simple
Butterfly Spreads in Futures | EdgeShorts: Futures, Fast & Simple
🚀 Real Benefits, Real Impact: EdgeClear Supports St. Jude
Trade Futures, Invest in Hope | EdgeClear x St. Jude Campagin
Understanding Treasury Spreads | EdgeShorts: Futures, Fast & Simple
Trading Strategy vs. Execution | EdgeShorts
What Is Revenge Trading? | EdgeShorts
Understanding Open Interest | EdgeShorts
Understanding Futures Expiration | EdgeShorts
RTH VS ETH | EdgeShorts
Designated Data Feeds | EdgeShorts
Risk Management in Futures | EdgeShorts: Futures, Fast & Simple
Bullish & Bearish Triangle Patterns | EdgeShorts: Futures, Fast & Simple
Understanding Volume Profile | EdgeShorts: Futures, Fast & Simple
Understanding Double Tops | EdgeShorts: Futures, Fast & Simple
Vertical Options Strategy | EdgeShorts: Futures, Fast & Simple
What Are Trend Lines? | EdgeShorts: Futures, Fast & Simple
Footprint Charts | EdgeShorts
What Is Price Discovery? | EdgeShorts
Price Limits and Banding | EdgeShort
What Is a VPS? | EdgeShorts
Understanding Options on Futures | EdgeShorts
Trading During High Volatility | EdgeShorts
TradingView Ideas
VIEW ALL posts
CL1!
, 1D
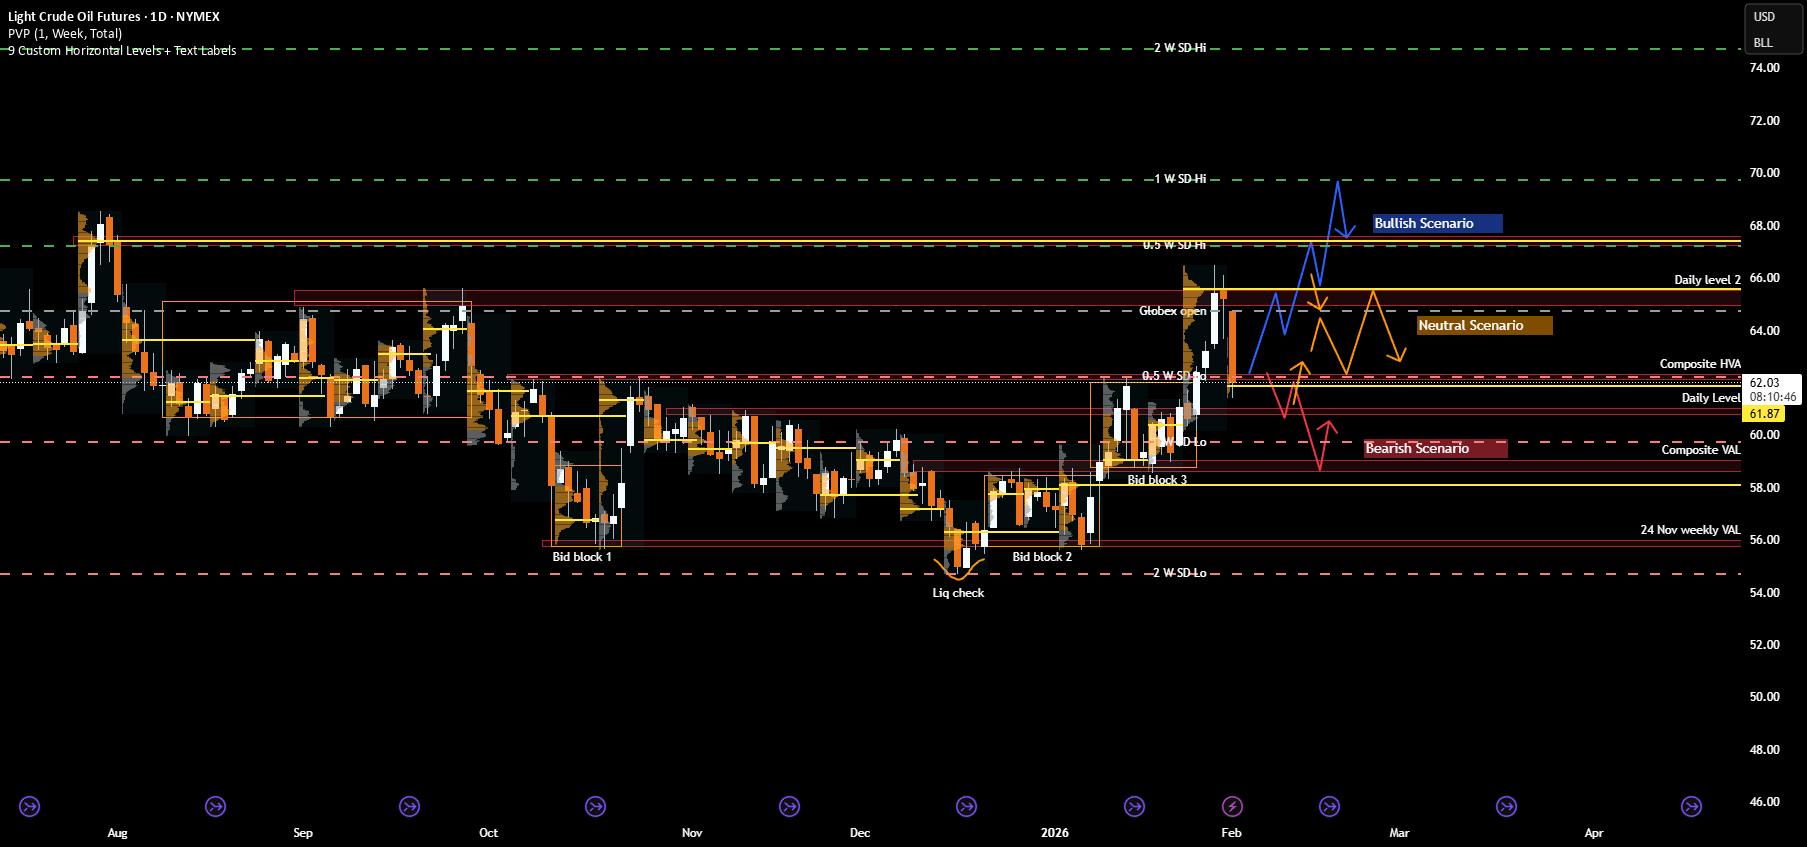
CL: Crude Oil at a Crossroads as Geopolitics Meet Key Levels
Recent Sentiment and Key Headlines Driving Crude
Crude oil sentiment over recent weeks has been shaped by a renewed mix of geopolitical risk and shifting expectations around global supply discipline. Headlines tied to Venezuela and Iran have been particularly influential, adding a layer of risk premium back into the market after a prolonged period of bearish positioning.
In Iran, renewed domestic unrest has been a notable catalyst. Protests that emerged in late December were initially sparked by economic pressures, including currency weakness, elevated inflation, and deteriorating living standards. As demonstrations spread across several major cities, concerns shifted from purely domestic stability toward potential implications for energy production and exports. While Iranian crude flows have not seen immediate disruption, the market has reacted to the increased uncertainty around enforcement of sanctions, internal security priorities, and the broader risk of escalation in an already fragile region.
Venezuela remains another key variable. Ongoing questions around sanctions compliance, export licenses, and the sustainability of recent production gains have kept traders cautious about assuming incremental supply will remain consistent. Any tightening of enforcement or breakdown in negotiations could quickly alter expectations, particularly given the market’s sensitivity to marginal barrel availability.
Beyond geopolitics, crude continues to trade against a mixed macro backdrop. Global growth expectations remain uneven, with slowing industrial activity in some economies offset by resilient consumption elsewhere. At the same time, OPEC plus communication has reinforced a willingness to manage supply if downside pressure accelerates. Together, these factors have kept sentiment reactive and highly responsive to both headlines and technically defined levels rather than driven by a clear fundamental trend.
What the market has done
• In November 2025, the market was in a grind trend down to bid block 1, where there was a liquidity check and buyers responded by holding the 56 level.
• Since December, the market has been in a block step trend up due to improving risk sentiment, renewed geopolitical premium, and reduced willingness by sellers to press below established value.
• In the past week, the market imbalanced out of bid block 3 above the 62.4 area (the composite HVA) and rotated higher toward the 65 area at daily level 2. This move coincided with a noticeable rise in geopolitical risk premium in oil markets as tensions between the U.S. and Iran escalated. Markets were responding to reports that the U.S. was considering possible military action if Iran did not negotiate a settlement on key issues, which was interpreted by traders as increasing the chance of supply disruption in the Persian Gulf. This elevated risk pricing helped push crude higher into the 65 area as participants priced in the possibility that instability could affect exports or shipping routes through the Strait of Hormuz. During the same period, there were also reports that Iran had announced live-fire exercises in the Strait of Hormuz, a key oil chokepoint, reinforcing those risk premiums even though no actual supply disruption occurred. The combination of geopolitical headlines and elevated risk appetite drove sellers to defend higher levels only after the initial breakout, leading the market back down toward 62.5 where responsive orders re-entered.
• Sellers responded by pushing price back down toward the 62.5 area, which corresponds with the weekly 0.5 SD low, signaling responsive selling rather than initiative downside continuation. This pullback was supported by an easing of the geopolitical risk premium that had driven the prior breakout. Over the weekend, no U.S. strike on Iran actually took place, and comments from U.S. leadership over the weekend suggested that Iran and Washington were “seriously talking” about negotiations rather than immediate military action. These remarks reduced the acute fear of an imminent strike that had been pushing oil toward multi-month highs late last week. As a result, the risk premium priced into crude unwound somewhat when markets reopened, and prices retraced back toward the 62.5 area as traders reassessed the likelihood of a near-term supply disruption.
What to expect in the coming weeks
The 62.5 area, which marks the level where the market imbalanced out of bid block 3 last week, remains the key level to monitor.
Bullish Scenario
• If the market holds above the 62.5 area, expect a rotation back up toward the 66 area (daily level 2), where sellers are likely to respond initially.
• If sellers fail to regain control at 66, the market could extend higher toward the 67.5 area, which aligns with the 28 Jul 2025 VPOC and the weekly 0.5 SD high.
• Acceptance above that zone would open the door for a test of the 70 area, corresponding with the weekly 1.0 SD high and a more pronounced shift in medium term structure.
Neutral Scenario
• If buyers defend the 62.5 area but sellers respond firmly at 66, expect a two-way auction to develop.
• In this case, price is likely to re- establish value and work through the repair of the previous week’s LVA, favoring rotational trade rather than trend continuation.
Bearish Scenario
• If buyers fail to defend the 62.5 area, expect a move back down into bid block 3 toward 59.7, which aligns with the weekly 1.0 SD low.
• Further downside could test the 59 area, defined by the bid block 3 low and the CVAL, where buyers are expected to respond and attempt to stabilize price.
Conclusion
Crude oil is currently balancing well defined technical structure against an evolving geopolitical backdrop. Risk premiums re-entered the market as unrest in Iran, U.S. rhetoric around a potential strike, and Iran’s live firing exercises near the Strait of Hormuz raised concerns about supply disruption, even though no strike ultimately materialized. The absence of escalation over the weekend led to some unwinding of that premium, reinforcing the recent pullback as responsive rather than initiative selling. At the same time, Venezuela remains a moderating variable, with questions around sanctions enforcement and incremental supply limiting follow through on both extremes.
From a technical perspective, price remains anchored around the 62.5 area, which continues to act as the primary pivot for directional intent. Acceptance above this level would favor renewed upside rotation toward higher distribution targets, while failure to hold would suggest a return into lower value and corrective trade. As geopolitical headlines continue to ebb and flow, traders should remain focused on how price responds at key levels.
If you found this analysis helpful, consider sharing your own levels or scenarios and join the discussion below
Disclaimer: This is not financial advice. Analysis is for educational purposes only; trade your own plan and manage risk.
Acronyms:
C - Composite
w - Weekly
m - Monthly
VAH - Value Area High
VAL - Value Area Low
VPOC - Volume Point of Control
LVN - Low Value Node
HVN - High Value Node
LVA - Low Value Area
SP - Single print

NG1!
, 1D
NG: Natural Gas Surge as the Polar Vortex Tests the Upper Range
Market Overview and Key Drivers
Natural gas futures are among the most seasonally sensitive products in the commodity markets, with prices largely driven by predictable demand cycles and unpredictable weather shocks. Demand typically begins to build in late summer, with prices often finding seasonal lows between July and August before rallying into September and October as the market prices in winter heating demand. Volatility generally accelerates from November through February, when cold weather events, storage draws, and forecast revisions can rapidly shift sentiment. As winter demand fades, prices often soften into March and April, followed by a weaker period in May and June as heating demand subsides and storage injections resume.
Beyond seasonality, traders closely monitor weekly EIA storage reports, temperature forecasts measured through heating degree days, production trends, and LNG export flows. Short term price discovery is frequently driven by changes in weather models, while medium term direction is shaped by whether storage levels and production trends confirm or contradict seasonal expectations.
Natural gas does not maintain a consistent correlation with other energy products, as pricing is driven more by regional supply and demand than global macro flows. That said, broader risk sentiment and energy sector positioning can still influence short term price behavior. Volatility remains elevated, especially during winter, when forecast changes can reprice the market quickly.
Over the past week, natural gas prices reacted sharply to weather driven headlines. A polar vortex warning across large parts of the United States triggered a surge in short term demand expectations, leading to an aggressive upside move. This rally pushed price into the upper portion of the broader multi-year range.
What the market has done
• The market remains within a larger multi-year range, with clearly defined weekly resistance in the 5.8 to 6.0 area and weekly support near the 3.2 area.
• Since the end of winter in 2025, price has respected a block step trend down, consistently rotating lower after each failed rally attempt.
• The market began its seasonal rally in September, driven by expectations of increased winter heating demand and tightening balances.
• Sellers responded aggressively at the start of December at offer block 2, auctioning price lower and pushing the market back toward the 3.2 weekly support area.
• In the past week, a polar vortex weather warning across the United States triggered a sharp upside spike, driving price toward the 5.6 area, aligning with offer block 1 near the top of the multi-year range and directly into the March 2025 mVAH.
What to expect in the coming weeks
The key level to monitor remains the 5.0 area, which aligns with daily level 1, the March mVAL, and the April mVAH. This zone is likely to act as the primary decision point for both buyers and sellers as the winter season progresses.
Bullish scenario
• If the market holds above the previous week’s close at 5.278, continued momentum could carry price higher toward the 6.0 area.
• The 6.0 level aligns with weekly resistance and the upper boundary of the multi year range.
• Sellers are expected to respond aggressively in this area, potentially leading to rotational or rejection based price action rather than sustained breakout behavior.
Neutral scenario
• Price may balance between the 5.0 area and the 5.75 zone for the remainder of the winter season.
• This range represents a region of prior acceptance, with 5.75 aligning with weekly resistance and the March 2025 mVAH.
• In this scenario, traders should expect two sided trade and rotational behavior rather than directional continuation.
Bearish scenario
• If buyers fail to hold price above the 5.0 area, long liquidation could accelerate.
• A downside move could target the SOC, repairing single prints left behind during the recent weather driven rally.
• Buyers are expected to respond near the 4.47 and 4.25 area, which aligns with the December 2025 VPOC and daily level 2.
Conclusion
Natural gas remains a headline driven market where technical structure and macro fundamentals must be evaluated together. While seasonal demand and extreme weather events continue to support volatility, the broader market remains constrained within a well defined multi year range. From a technical perspective, acceptance or rejection around the 5.0 area will likely dictate whether price continues higher toward weekly resistance or rotates lower to repair unfinished auctions. Fundamentally, traders should remain alert to shifts in weather forecasts, storage trends, and production data, as these factors can quickly invalidate technical setups. As winter unfolds, traders will need to respect the speed of rotations and the market’s tendency to punish late positioning near range extremes.
If you found this analysis helpful, consider sharing your own levels or scenarios and join the discussion.
Disclaimer: This is not financial advice. Analysis is for educational purposes only; trade your own plan and manage risk.
Acronyms:
C - Composite
w - Weekly
m - Monthly
VAH - Value Area High
VAL - Value Area Low
VPOC - Volume Point of Control
LVN - Low Value Node
HVN - High Value Node
LVA - Low Value Area
SP - Single print

PL1!
, 1D
PL: Platinum at an Inflection Point
Why Platinum Is Moving
Platinum is a unique metal that sits at the intersection of precious and industrial markets. Unlike gold, which is primarily viewed as a monetary or store of value asset, platinum derives a larger share of its demand from industrial uses. Silver sits between the two, with meaningful industrial demand alongside its role as a monetary metal. These include catalytic converters, chemical processing, hydrogen related technologies, and jewelry. Because of this dual role, platinum tends to be more sensitive to shifts in global growth expectations than gold, while still reacting to macro forces such as inflation, real rates, and currency trends.
From a correlation standpoint, platinum often trades in sympathy with gold and silver during periods of broad commodity strength, but the relationship is not constant. Gold typically leads during risk off environments, while platinum performs best when growth expectations improve and industrial demand increases. In recent months, platinum has begun to decouple from gold, showing relative strength as investors price in tighter physical supply and improving demand narratives. Silver has also participated in this move, but platinum’s advance has been more structurally driven rather than purely momentum based.
Recent sentiment has shifted materially since December 2025. After spending years trapped in a large consolidation range, platinum finally attracted sustained institutional interest. Supply constraints from major producing regions, rising costs of extraction, and renewed interest in platinum as a substitute metal in industrial applications have all contributed to the move higher. The breakout since December 2025 reflects a repricing of long term value rather than a short term speculative spike, which helps explain the persistence of the trend despite periods of volatility.
What the Market has done
• The market has been on a bullish uptrend since markets broke out of a multi year consolidation and accumulation range that lasted from December 2021 to June 2025.
• Markets formed two clear accumulation ranges during the advance, suggesting strong two way trade before higher prices were accepted.
• At the start of December 2025, market compressed against daily level 1, forming bid block 1 as buyers continued to absorb supply.
• Buyers initiated higher from this compression and pushed price to new ATHs in the spot market.
• Sellers responded aggressively at the end of December 2025, resulting in a volatile two way whipsaw and expanded range.
• Over the past two weeks, market volatility has contracted and the overall range has narrowed as the market works to establish a new value area at higher prices.
What to expect in the coming week
Key reference levels remain 2500, which marks the CVAH, and 2330, defined by the 5 Jan wVAH and the 12 Jan wVAL. These levels frame the current auction and provide clarity for upcoming scenarios.
Neutral scenario
• Continued two way balanced rotation between 2500 and 2330 would suggest acceptance of higher prices.
• This behavior would indicate responsive participation from both buyers and sellers rather than initiative control.
• Value may continue to build above prior ranges, reinforcing the broader bullish structure without requiring immediate continuation.
Bearish scenario
• If buyers are unable to defend the 2330 area, the auction is likely to rotate lower in search of demand.
• A move toward 2136.9, which aligns with the 5 Jan wVPOC, would be the first downside repair target.
• Continued acceptance below that level could expose the 2069 area, where the CLVN remains untested.
Bullish scenario
• If the market is able to break and accept above 2500, buyers may regain initiative control.
• Acceptance above the CVAH would signal strength and continuation of price discovery.
• This scenario increases the probability of a move toward new ATHs, particularly if value begins to migrate higher.
Conclusion
Platinum’s breakout is occurring against a backdrop of tightening supply, improving industrial demand expectations, and a broader commodity bid as inflation and growth dynamics remain in focus. While the structural shift higher is notable, history offers an important reminder. The last time platinum entered a parabolic phase in 2008, the move was followed by a 67% drawdown that erased four years of gains in just four months. As price continues to build value at higher levels, respecting both macro drivers and auction behavior will be critical in navigating the weeks ahead.
If you found this analysis useful, feel free to give a boost, comment, or share your own levels and scenarios below.
Disclaimer: This is not financial advice. Analysis is for educational purposes only; trade your own plan and manage risk.
Acronyms:
C - Composite
w - Weekly
VAH - Value Area High
VAL - Value Area Low
VPOC - Volume Point of Control
LVN - Low Value Node
HVN - High Value Node
LVA - Low Value Area
SP - Single print
Blog Highlights
VIEW ALL posts

Video Highlights
Learn More
How to Select a Futures Market Data Provider | w/ FuturesTrader71 and Edge Clear
Why Do You Need a Futures Broker? | EdgeShorts: Futures, Fast & Simple
Top 3 Trading Platforms | EdgeShorts: Futures, Fast & Simple
Guides & How-Tos
VIEW ALL posts

Max
August 13, 2024
Ian Blanke
May 1, 2025
Ian Blanke
September 9, 2025