December 02,2024 @10:21 AM
Many futures traders, including myself, are wondering one big question—can gold sustain its push to new highs? Seeing gold print all-time-highs alongside the S&P 500 (ES) may seem unusual, as some traders view these assets as inversely correlated. Historically, a rise in the ES would coincide with a gold sell-off, and vice versa. However, this perspective is generally short-term. Let’s unpack the current rally in gold to evaluate whether we may see a retracement or continued rise into the upcoming new year.
Correlation between Gold and the ES
Long-Term Correlation
In the long run, gold and the S&P 500 exhibit a high positive correlation, particularly during bull markets. From 2018 to 2023, the two showed a +80 correlation, demonstrating that during economic expansions, both assets can rise simultaneously. This long-term perspective helps contextualize recent movements, suggesting that these assets moving together might not be as unexpected as it may seem.
Medium-Term Correlation
Over shorter one to two-year periods, this correlation softens. Between 2022 and 2023, the correlation dropped to +51%, showing that gold can still serve as a viable portfolio diversifier during more uncertain economic times. While less consistent, the relationship between gold and the S&P 500 can offer traders insights into broader market sentiment without suggesting a strict inverse correlation.
Short-term Correlation
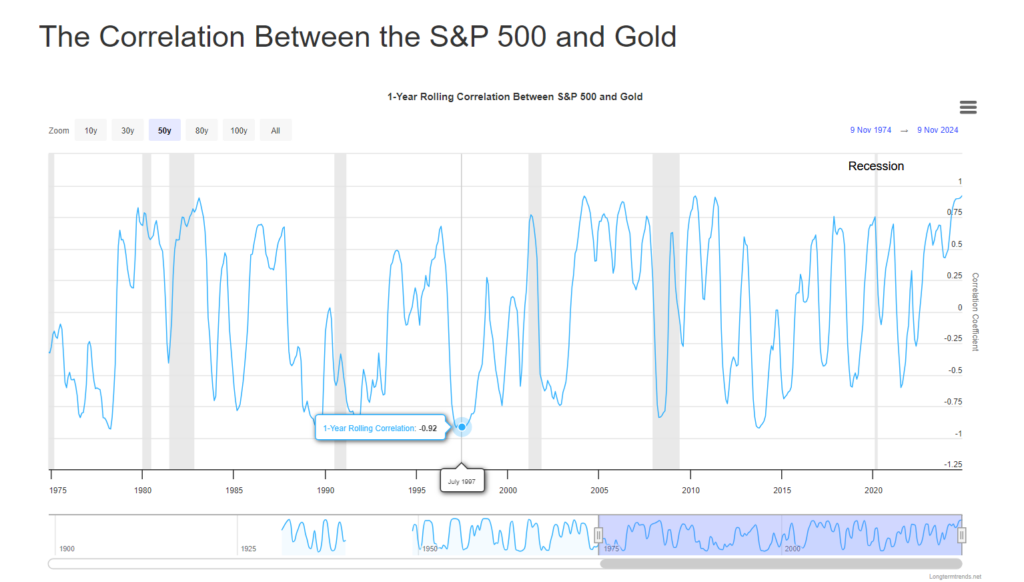
Short-term, this correlation can be volatile. In August 2024, the correlation between gold and theS&P 500 reached the most significant high since November 2005, at +0.927. However, it soon dropped to +0.022 and eventually reversed to -0.171. This rapid fluctuation demonstrates how quickly market sentiment can shift within the short term.
Traders observing the current rally in gold and the S&P 500 might find it useful to consider historical instances where these assets moved together. There have been many periods where gold and the ES have moved in tandem, displaying a high positive correlation. However, this relationship is extremely dynamic and can change quickly. In my opinion, understanding the current level of correlation is essential when making trading decisions. The chart below illustrates the fluctuation in the gold/S&P 500 correlation over the last 50 years, highlighting the importance of tracking these shifts.

Correlation between Gold and the ES
Gold’s recent rise has been driven by several key factors, including the value of the U.S. dollar, interest rates, and significant central bank demand. Additionally, geopolitical uncertainty continues to play a role, as gold has traditionally been a hedge against economic instability.
Central bank activity has been a major driver of demand, as the World Gold Council’s Q2 2024 Report highlights:
- Central banks, especially those within emerging markets, have increased their gold reserves as a diversification measure.
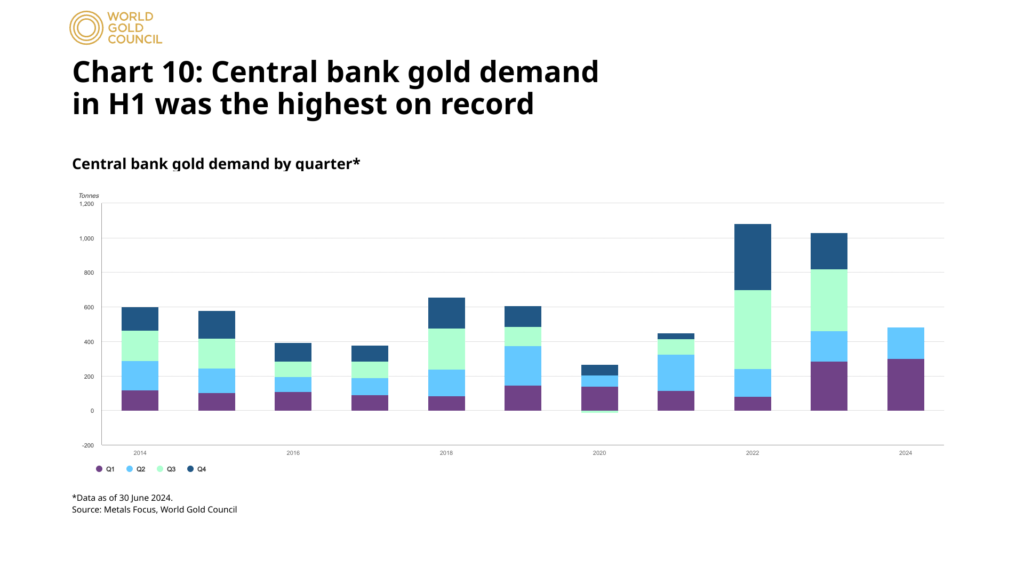
- Net buying in the first half of 2024 amounted to 483 metric tons, 5% above the previous record of 460 metric tons in the first half of 2023.
- Major buyers included Turkey, Poland, and India, showing a trend towards diversification across multiple regions.
- Economic risks and concerns about currency stability drive the sustained interest in gold.
- Overall, central bank demand for gold remains strong, reaffirming gold’s strategic financial role.
Over the past three years, central bank demand for gold has risen dramatically. This increase is driven in part by global uncertainties such as the Russia-Ukraine conflict and unrest within the Middle East. It is worth noting that while these factors play a role within gold’s recent rise it is essential to remain informed on current events, market news, and economic reports to gauge potential price movements. The chart below provides a view of central bank gold demand over the last decade, with notable peaks from 2022 to 2024 compared to previous years.

While this demand underpins gold’s price strength, a correction could still occur before we see further upward momentum.
Commitment of Traders (COT) Report Analysis
For those unfamiliar, the Commitment of Traders Report, or COT, from the CFTC provides weekly data on open interest positions in various futures markets. This data breaks down positions by commercial (hedgers), non-commercial (speculative), and non-reportable (small speculator) traders.
- Non-Commercial (Speculative): With large net long positions (366,636 contracts) and relatively low short positions (87,983, speculators appear to have a bullish sentiment on gold.
- Commercial (Hedgers): On the other hand, commercial traders hold substantial short positions (372,606 contracts), likely as a hedge against potential declines.
- Open Interest: The slight increase in open interest (+5,708 contracts) reflects consistent interest in the gold market.
- Spreads: The moderate level of spread positions (90,465 contracts) suggests a somewhat neutral or mixed sentiment.
From my perspective, the significant short interest among commercial hedgers, compared to speculators, raises a critical question: what insights might these commercial players have that speculators are missing? This data doesn’t necessarily indicate a clear bullish or bearish outlook, yet it inclines me personally towards caution. Given these conditions, I plan to approach my own gold trades conservatively, remaining mindful of potential downside risks amidst the mixed signals. For any further details on the COT, please refer to the full report here.
Technical Levels and Market Outlook
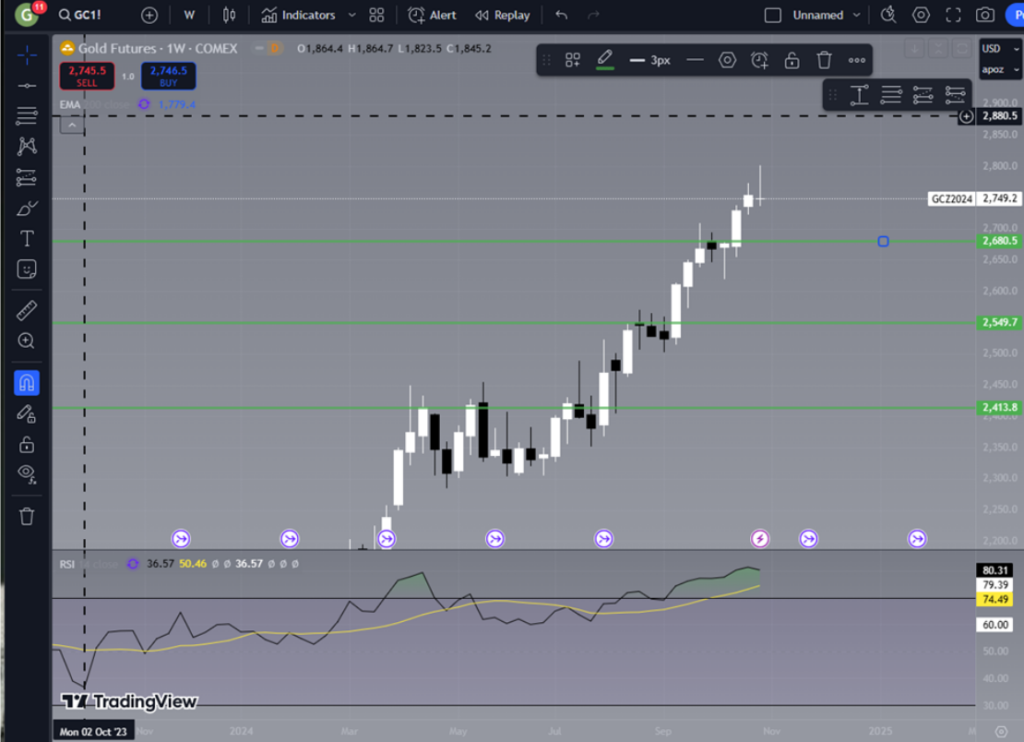
When it comes to technical analysis, I like to keep things simple by focusing on daily and weekly charts. I am currently monitoring three key support levels at $2,680, $2,549, and $2,413. Additionally, the Relative Strength Index (RSI) has shown overbought conditions for twelve weeks. The recent weekly close with a shooting star candlestick suggests a potential shift, with buyers losing momentum as seller’s gain ground.

While gold’s rally is backed by solid fundamentals, the potential for a correction looms above any continued rise. As with all market reflections, these insights are for informational purposes only, and traders should complete their own analysis to guide their decisions. With both opportunities and cautionary signs present, the future of gold remains open to interpretation.
Key Considerations Moving Forward
The gold market offers a unique blend of fundamental, technical, and macroeconomic factors that could continue to drive volatility in the months ahead. Here are a few key areas you should consider:
- As inflation rises, interest rates, and currency strength fluctuate, the demand for gold as a hedge may remain high. Be sure to keep an eye on Federal Reserve decisions and United States economic indicators, as these will likely impact gold’s trajectory.
- Ongoing conflicts, sanctions, and political shifts can impact global supply chains and investor sentiment. The more unstable the global political landscape, the more likely gold is to stand as a safe-haven asset.
- While gold mining and recycling rates remain stable, demand from sectors like jewelry, technology, and central bank reserves might sway supply and demand balances.
With various signals pointing to both caution and opportunities, gold’s future remains intriguing. All traders should stay informed and responsive to market developments to navigate the evolving gold prices. Happy trading!
Disclaimer: The views expressed are personal opinions and should not be interpreted as financial advice.
~ Giancarlo Saraceno, Senior Commodity Broker

