Quantower
Request a Rithmic Demo
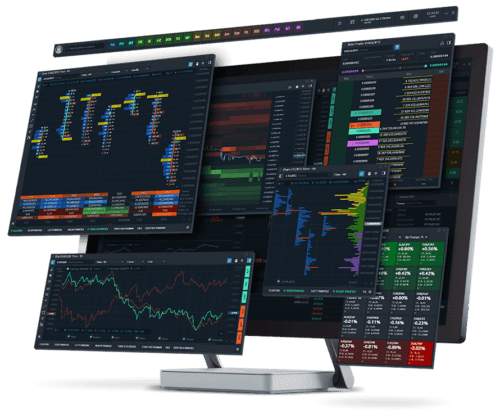
Charts
Get a trading advantage in the market using professional charting tools. Analyze the market with our easy-to-use features and an extensive list of chart types:
- Kagi, Renko, Point & Figure, Line Break
- Time-based chart with custom time periods
- Heiken-Ashi, Tick chart, Range Bars
The Depth & Sales is also your primary order entry tool, with one click trading, automated exit strategies, auto order types, volume-based stops, and the overall feel of an execution tool that could only have been developed by a fellow trader.
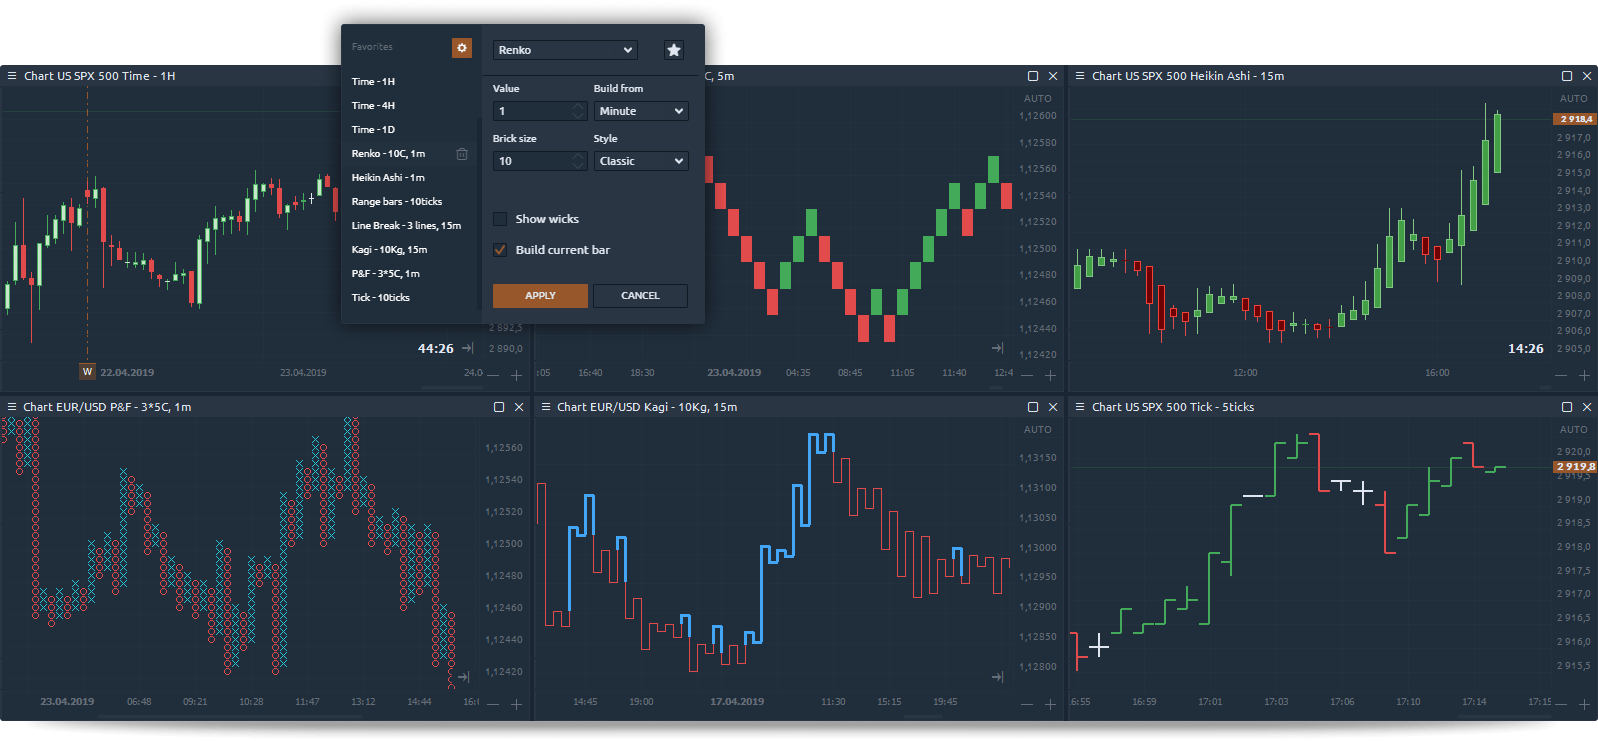
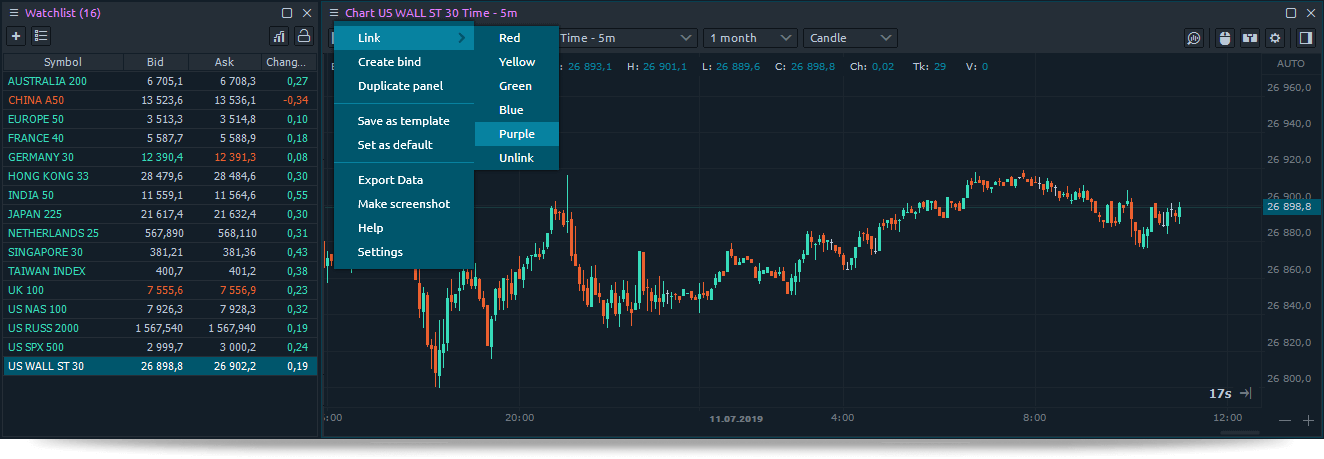
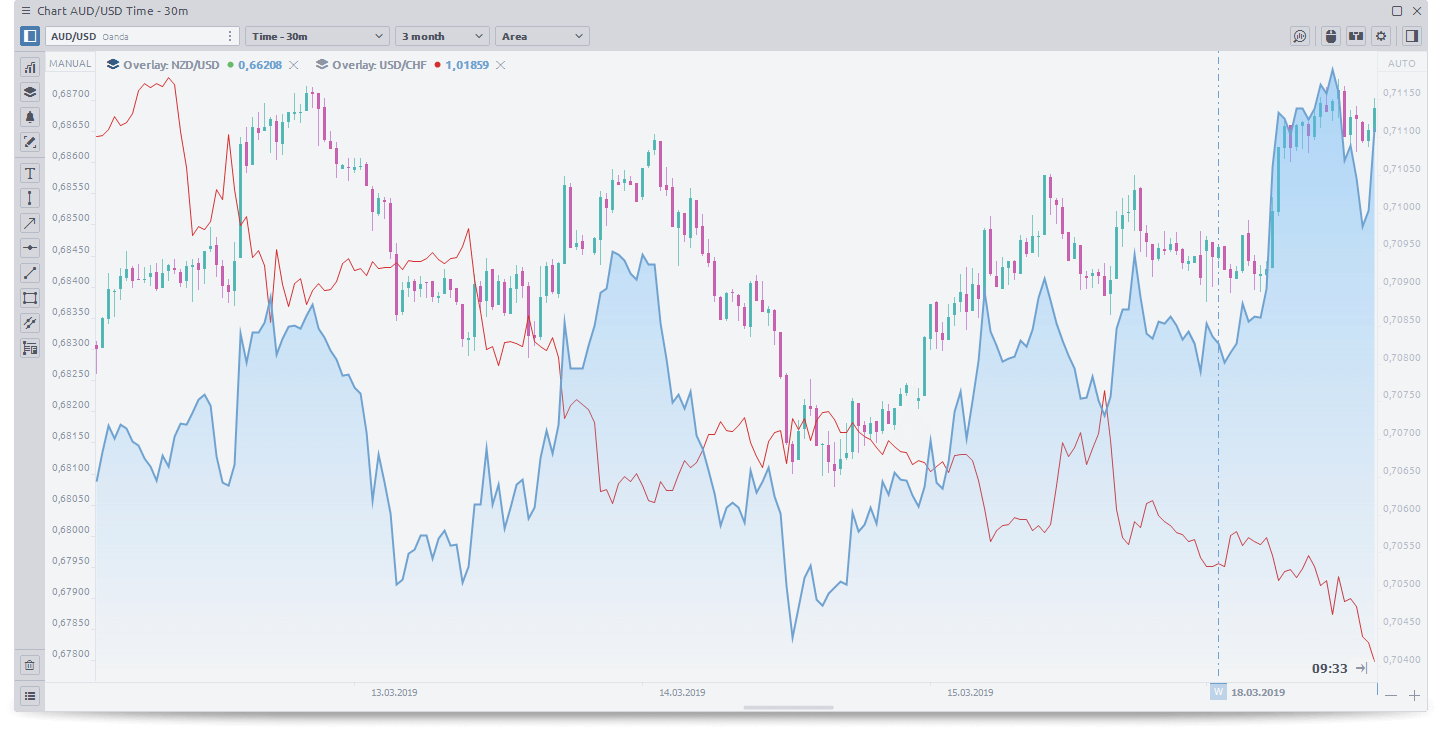
Chart overlays
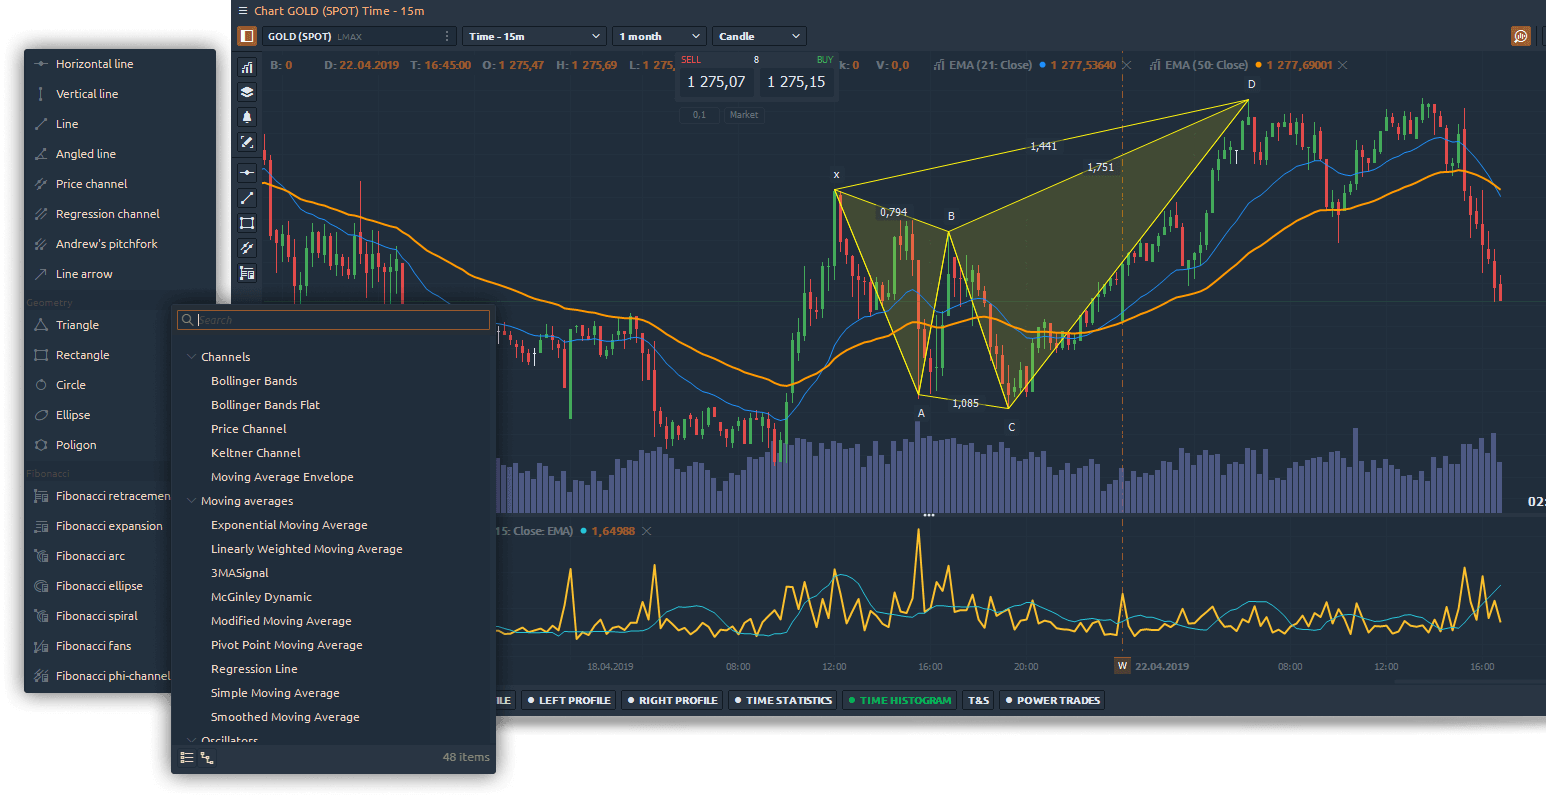
Drawings and indicators
Wide list of drawing tools and indicators are ideal for technical traders to analyze volatility, support & resistance, trends, as well as reversal points.
- Trends & Channels
- Geometry tools
- Fibonacci & Gann
- Harmonic patterns
- Text & Comments
- Channels
- Moving Averages
- Trends Volatility
- Volume
- Oscillators
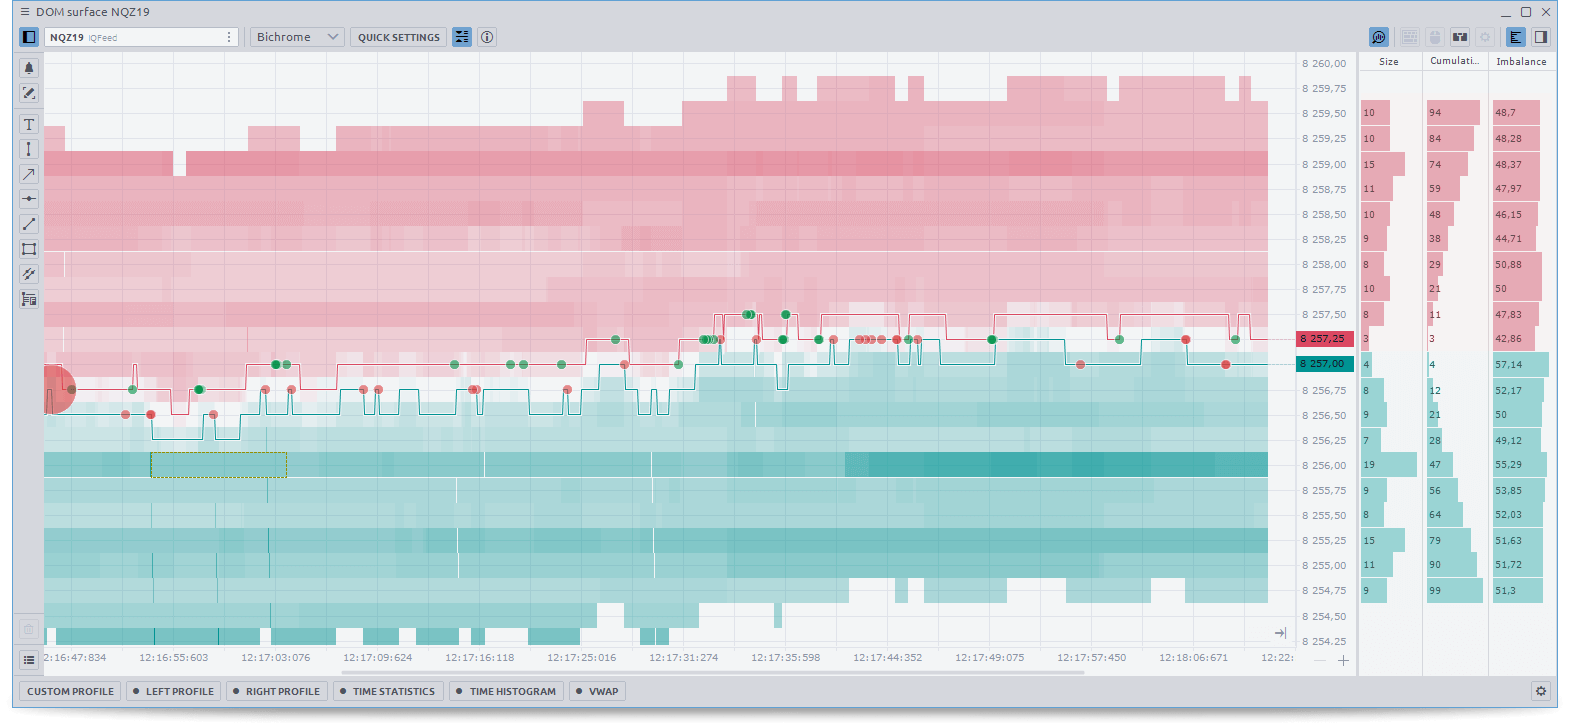
Order flow surface
Gain unique market insight by using Order Flow Surface. Find the most reliable price levels with a huge amount of limit orders that can affect the price movement
- Analyze Cryptocurrencies, Futures, Stocks, ETFs
- Use Volume Analysis Tools directly on the order flow chart
- Set different numbers of DOM levels for a clear picture
- Heatmap mode tracks the liquidity change at each price level
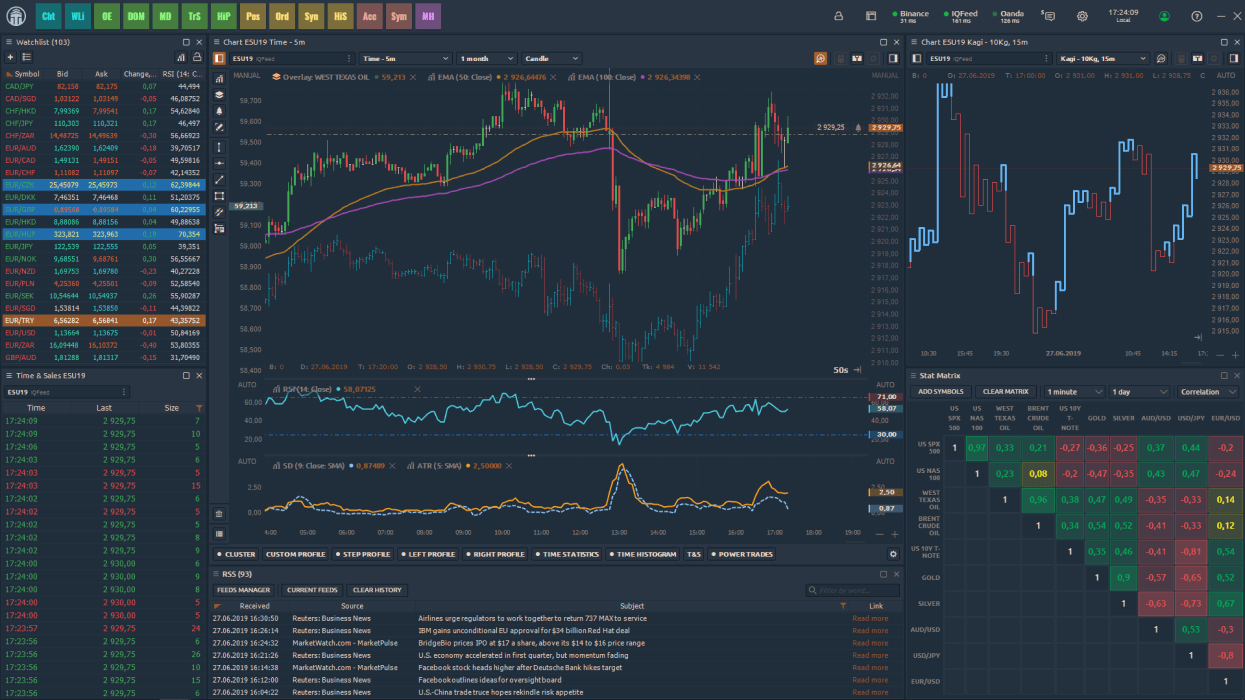
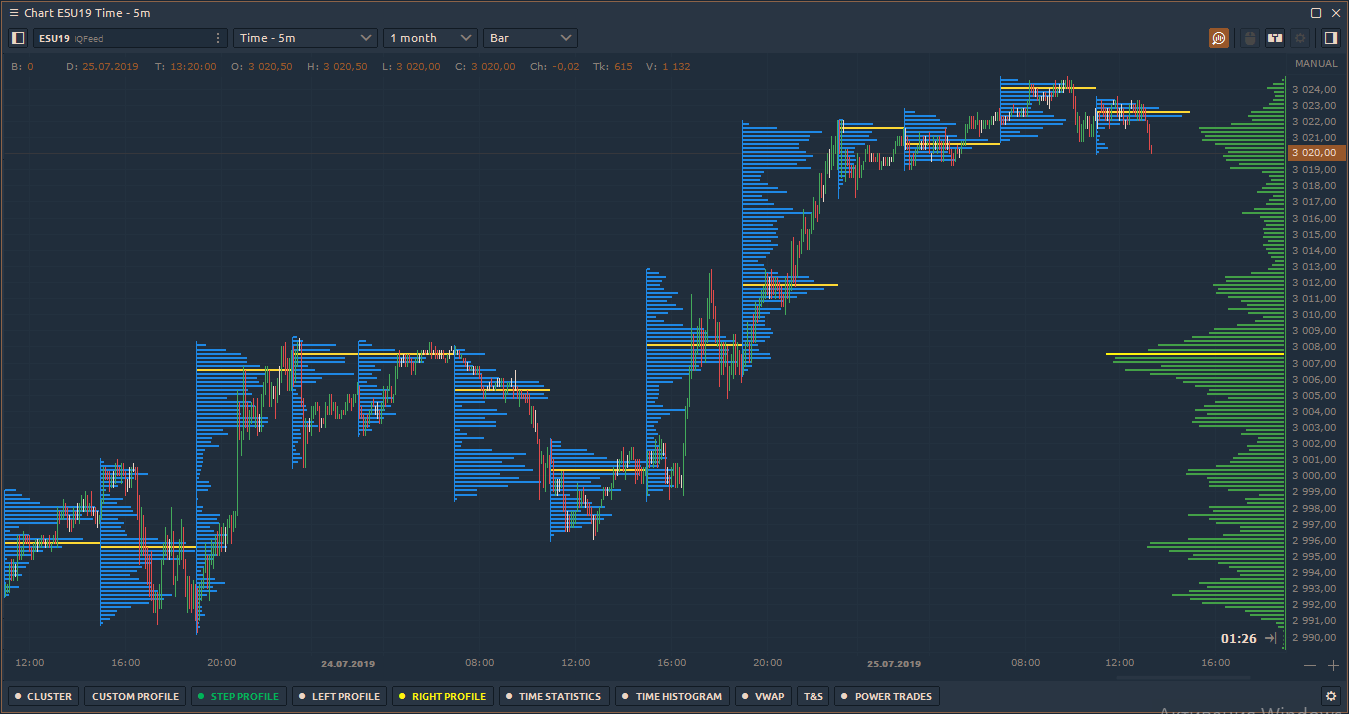
Volume analysis tools
Cluster Chart:
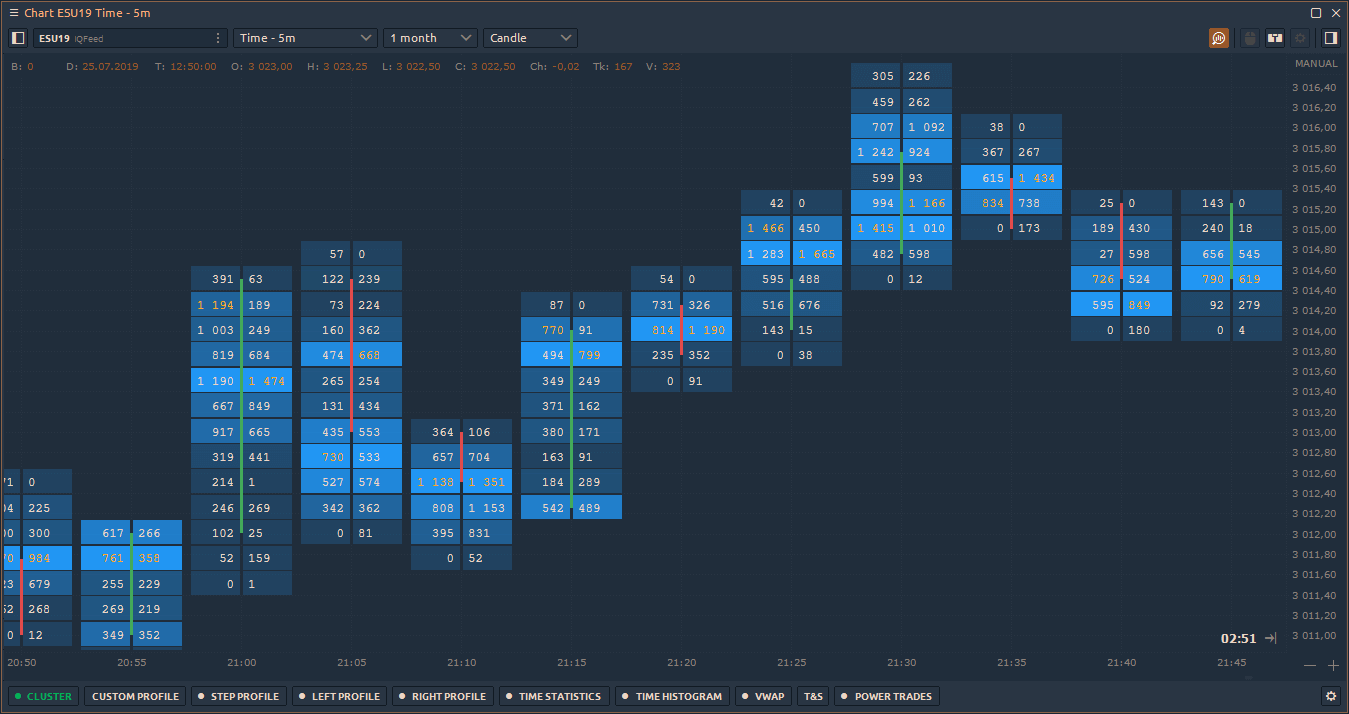
Volume Profile:
Historical Time and Sales:
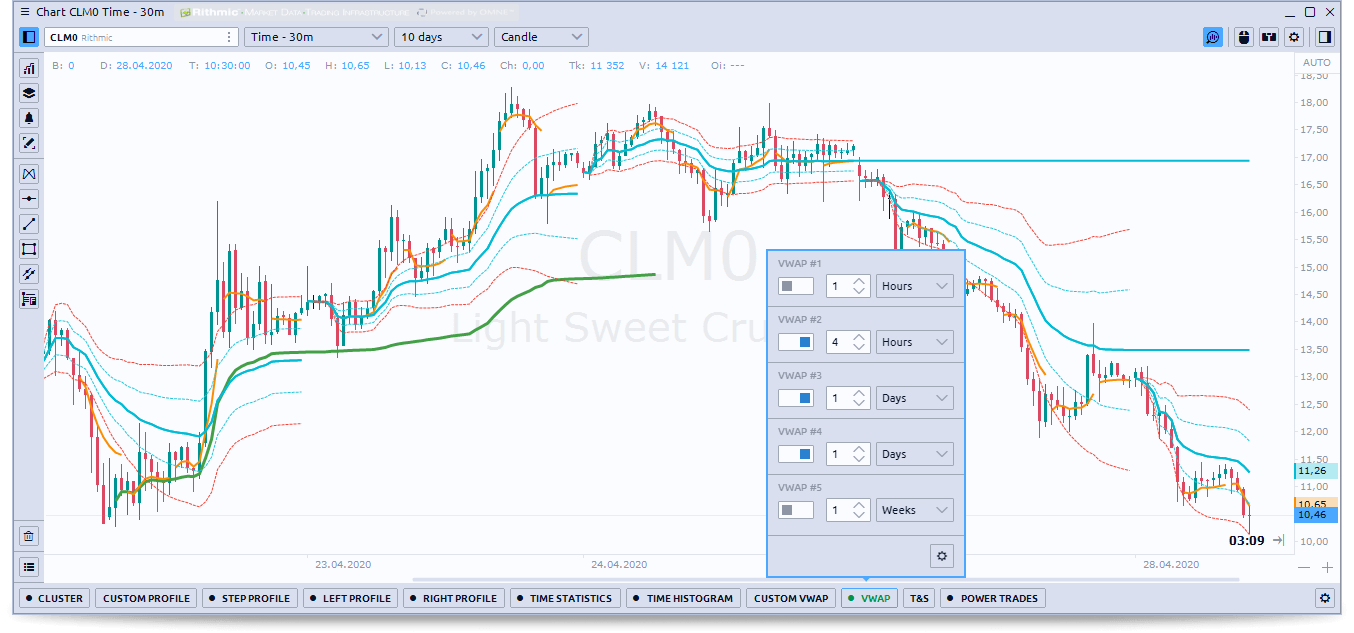
Volume weighted average price (VWAP)
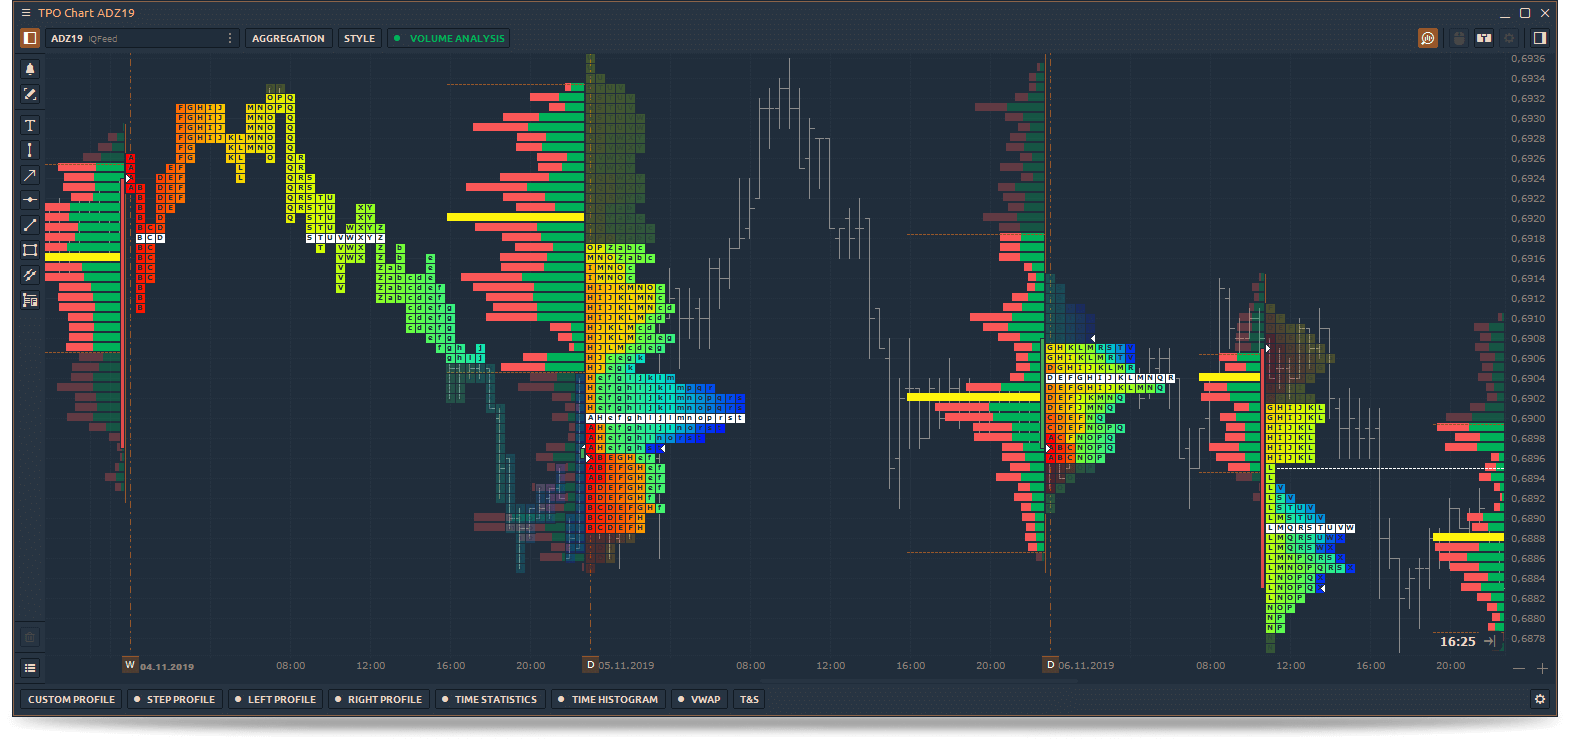
TPO profile chart
Analyze the TPO Profile to understand the price distribution during the day or trading session
- Shows crucial support/resistance price levels
- Display TPO Point of Control, Value Area and Singles
- Split & Merge TPO Profiles for all-around analysis