Jigsaw daytradr™
Built around proprietary trading techniques that institutional traders use every day, Jigsaw Trading tools are lightning fast and supremely effective. Able to accurately highlight events such as trapped traders, yet able to run ‘out of the box’. After all, if software is smart enough to hopefully help improve your edge in the market, it should NOT make you responsible for tuning 100’s of settings.
To view more available platforms provided by Edge Clear, please click here.
Request a Rithmic Demo
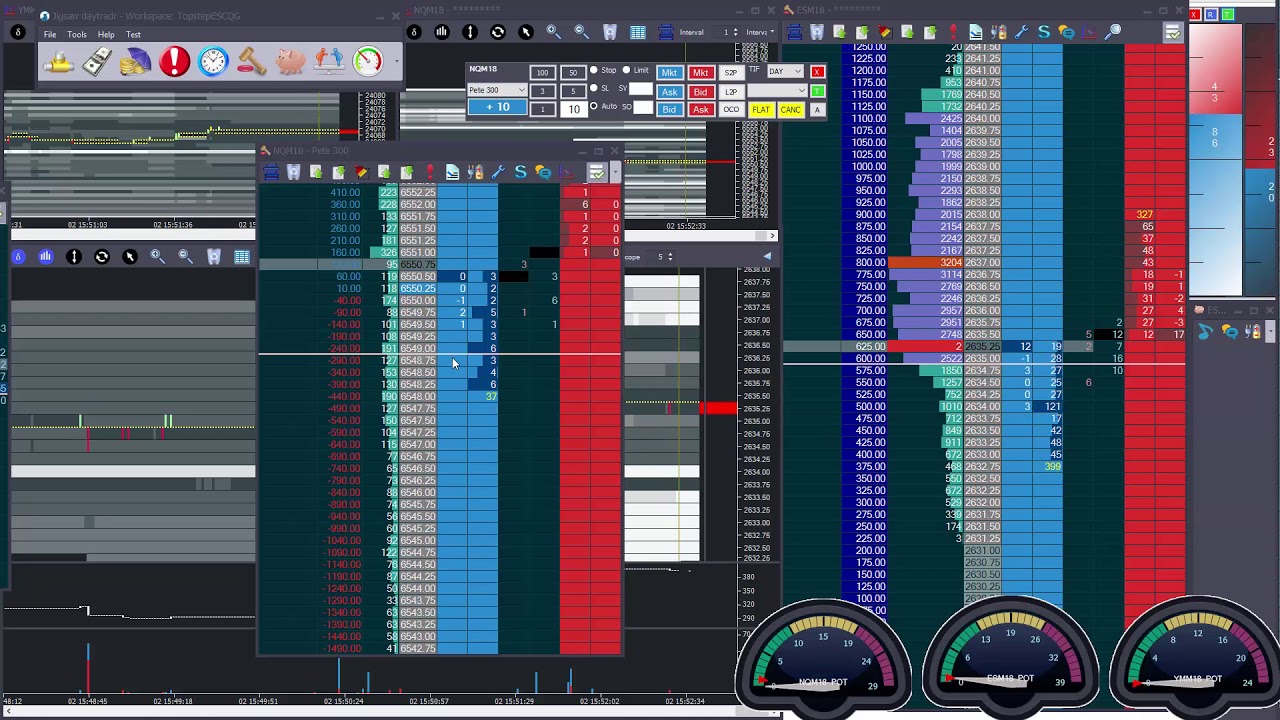
daytradr Trading Platform™
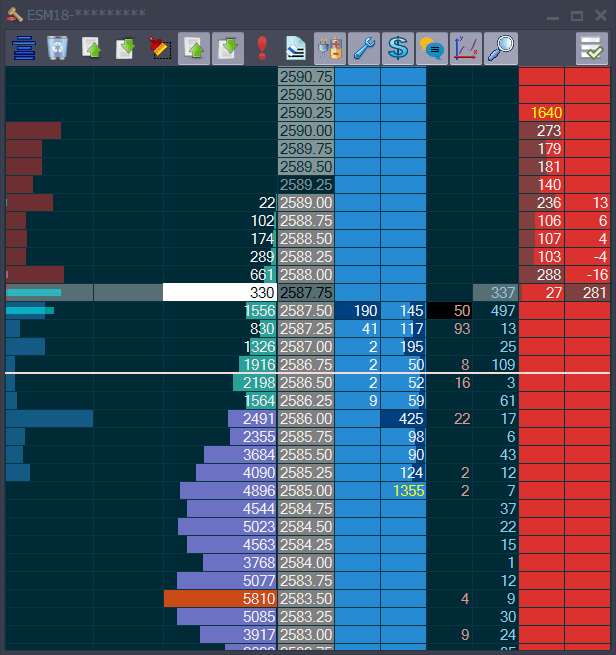
The Jigsaw Trading Depth & Sales shows:
- The impact of trades hitting the market
- Where traders are getting stuck
- Likely location of stop orders/where traders are positioned
- Where traders are pulling(cancelling) their orders, to avoid a move
- Where traders are stacking (iceberging) and front-running the market in anticipation of the market holding
- Balance of trade/momentum
- Alert column for pre-market notes
- Integration to JS Services Desktop
- Order Queue Position
- Trade P&L Per Price
The Depth & Sales is also your primary order entry tool, with one click trading, automated exit strategies, auto order types, volume-based stops, and the overall feel of an execution tool that could only have been developed by a fellow trader.
Auction Vista – Order Flow History
Auction Vista gives a detailed view of both real time and historical order flow. An extremely accurate ‘self-tuning’ view with very few settings required to get the most from it.
- Market Depth visualization
- Large Trade Circles
- Trade From Chart
- Price Delta Chart, Cumulative Delta, Volume Delta Bars, Depth Histogram and Flip Charts make this the most complete Order Flow chart on the market.
Realistic Trade Simulator
Learning to trade or learning a new strategy is problematic on most trade platforms. Unless you are trading live, with real money – you’ll never know how realistic the results are. That’s because most platforms take an optimistic view on the prices you’d be filled at. Jigsaw daytradr is different – it gives you realistic fills on Limit Orders and realistic slippage on Market and Stop Orders.
So, whether you are learning to trade OR trying out a new strategy, the Jigsaw Trading Simulator gives you a much more realistic set of results.
And Much More
- Reconstructed Tape – Time & Sales on steroids!
- Order Flow Event Alerts (iceberg alert, block trade alert, large trade alert, divergence alert)
- Innovative workspace management
- Position and Orders analysis window – with direct trading interface
- Custom Trading Sessions
- Automatic Symbol Download
- Exchange Traded Spread Support
- Equity Support (NASDAQ L2)
- Global Market Support – e.g. US, Europe, Hong Kong, Sydney, Osaka (additional markets added on request)