Investor R/T

Investor RT provides powerful market monitoring, data capture, charting, technical analysis, scanning, backtesting, and portfolio management features for users of a wide variety of real-time, delayed, and end-of-day market data services. Investor RT is a very powerful and extremely flexible software package, allowing you to customize your system to your specifications
To view more available platforms provided by Edge Clear, please click here.
Subscribe to IRT
Create a Rithmic Demo
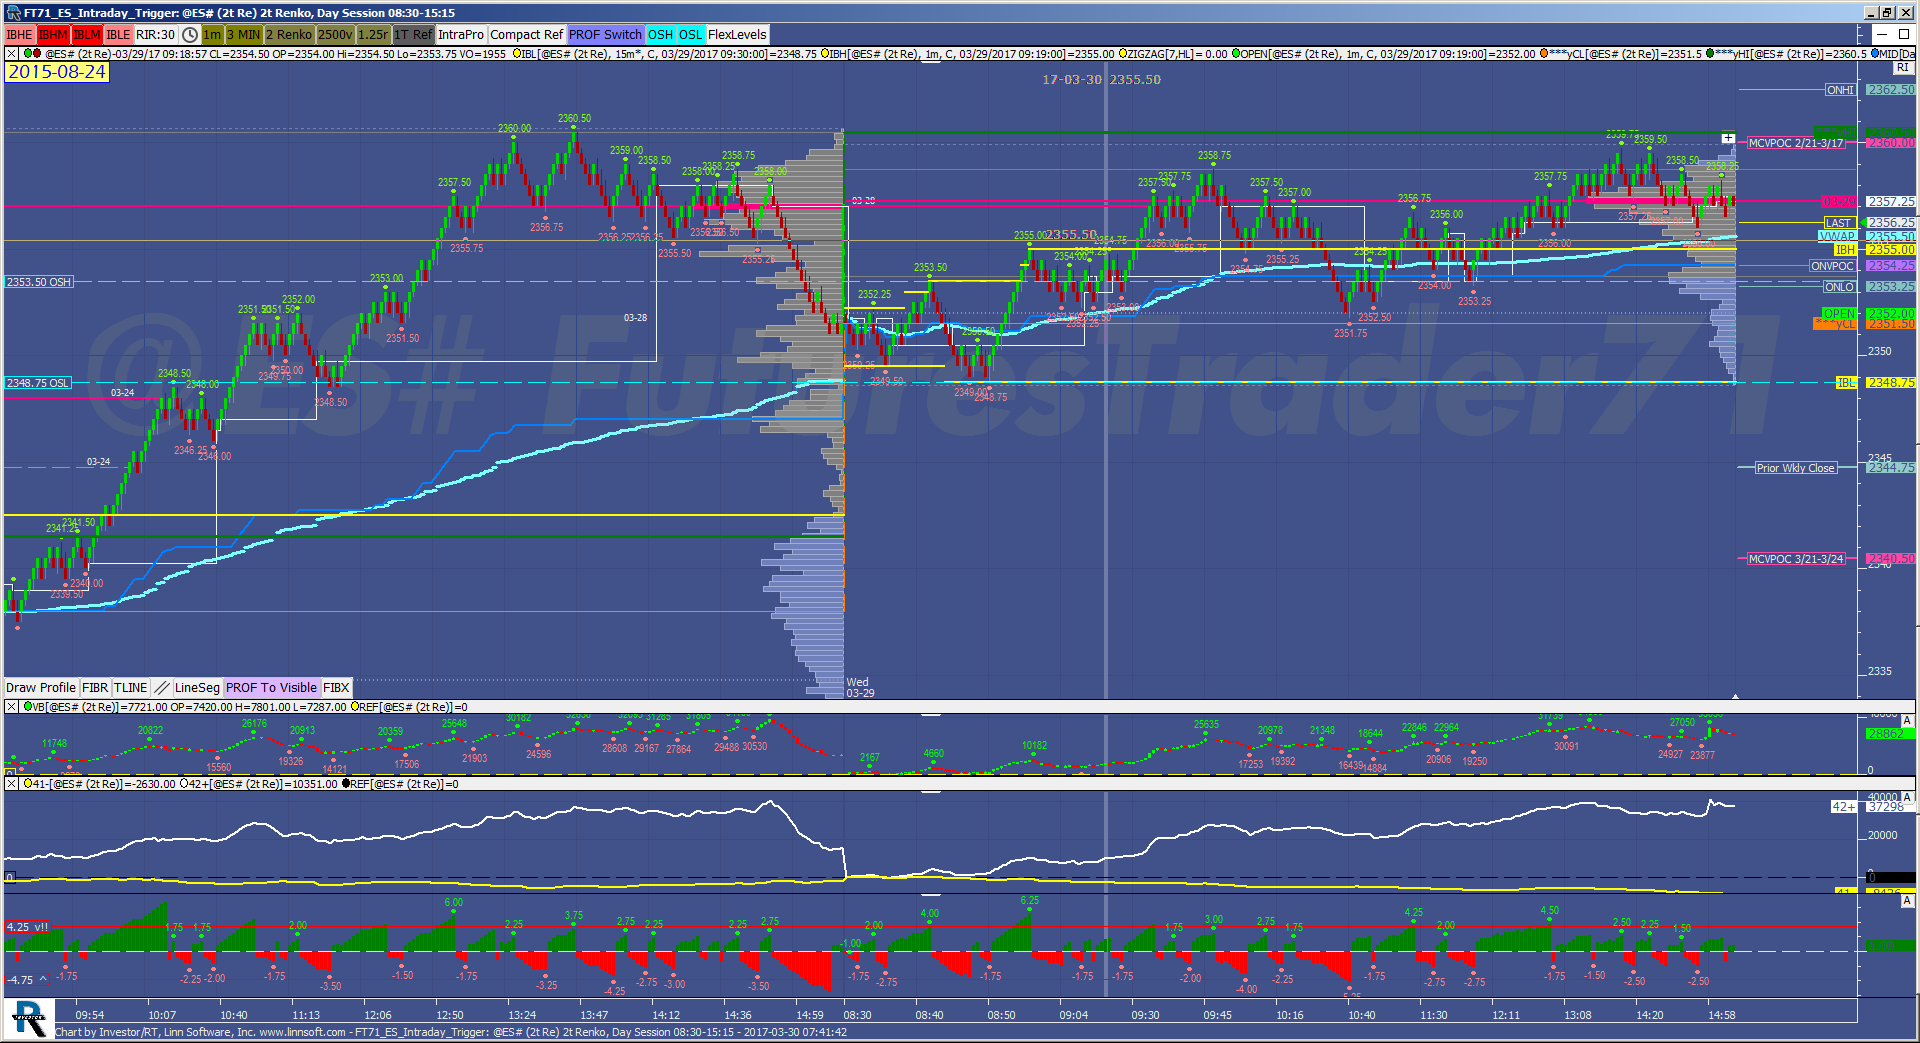
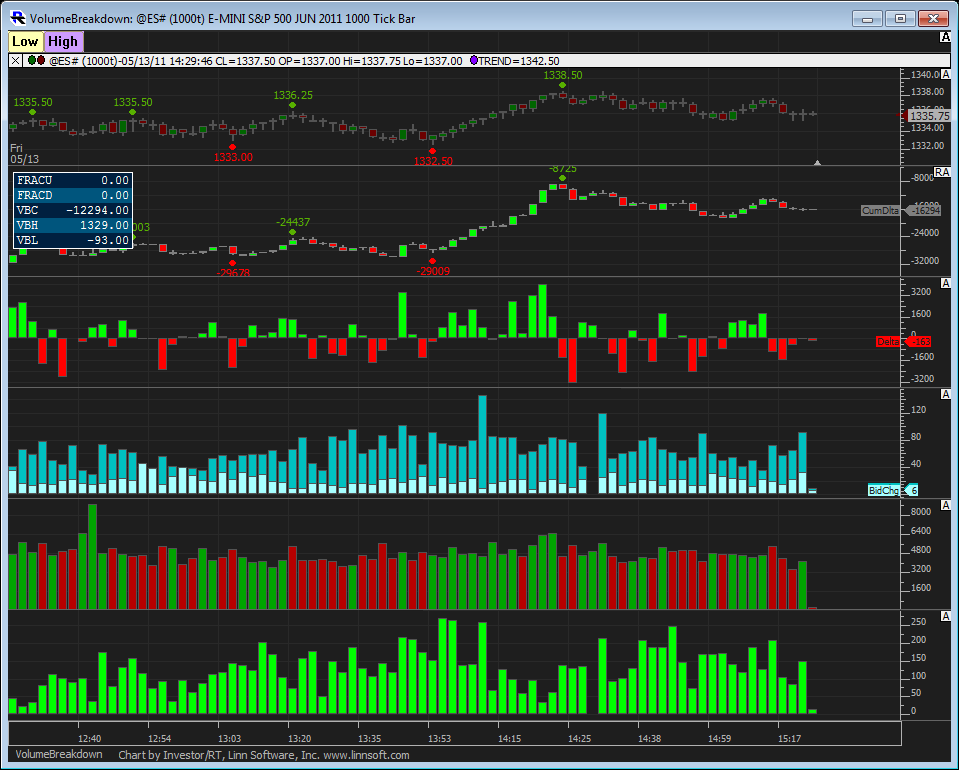
- View Buy Volume, Sell Volume, Total Volume or Time spent at Price Levels for any time period
- Split the Day Session from the Overnight Session to view each profile separately
- Use the Profile Drawing tool to draw a profile over any targeted custom period
- Extend Naked POC’s, VAH or VAL’s to the present trading day to uncover areas that have not been filled
Video timeline
- Introduction and Overview – What this video will be working towards, including images of the charts we will create during video
- Chart Setup – How to optimally setup a charts colors, bars, etc, for use with the Profile Indicator.
- Adding Profiles – Several different ways to add the Profile Indicator to a chart.
- Volume or Time – Basing the Profile Indicator on Price and Volume or Price and Time.
- Volume at Price – How volume is distributed among prices. How tick data and one minute data is distributed.
- Profile Duration – Various options for the amount of time covered in each profile. Single profiles versus multiple profiles.
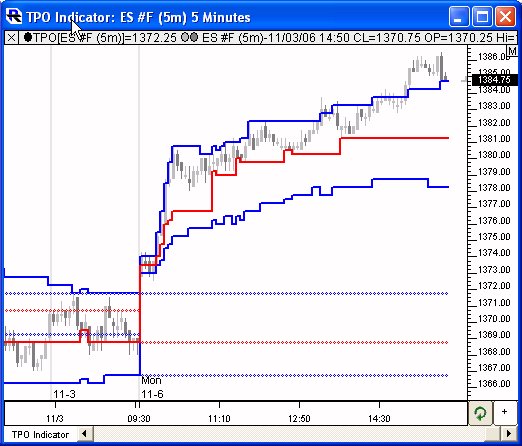
- POC / Value Area – Options for displaying the current and/or previous value area and point of control.
- Drawing Options – Options for what style is used for drawing the profiles, including hollogram, volume profile, lines, blocks, and more.
- Naked Lines – Extended naked POCs, highs, lows, or closes.
- Peaks/Valleys – High volume and low volume nodes.
- Miscellaneous – Review of several lesser used options of the Profile Indicator.
Additional Notes
The Profile Indicator requires the TPO Profile version of Investor/RT. Upgrading to TPO Profile is quick and easy from your account page Profile Indicator data can be easily exported to a text file which is formatted nicely for Excel. Right-click on the dotted rectangle around the Profile and choose “Export Data”. You’ll get something similar to this for every profile.
Subscribe to IRT

Open an Account Today!
Start Today!