Bookmap

The innovator of the historical order book heatmap
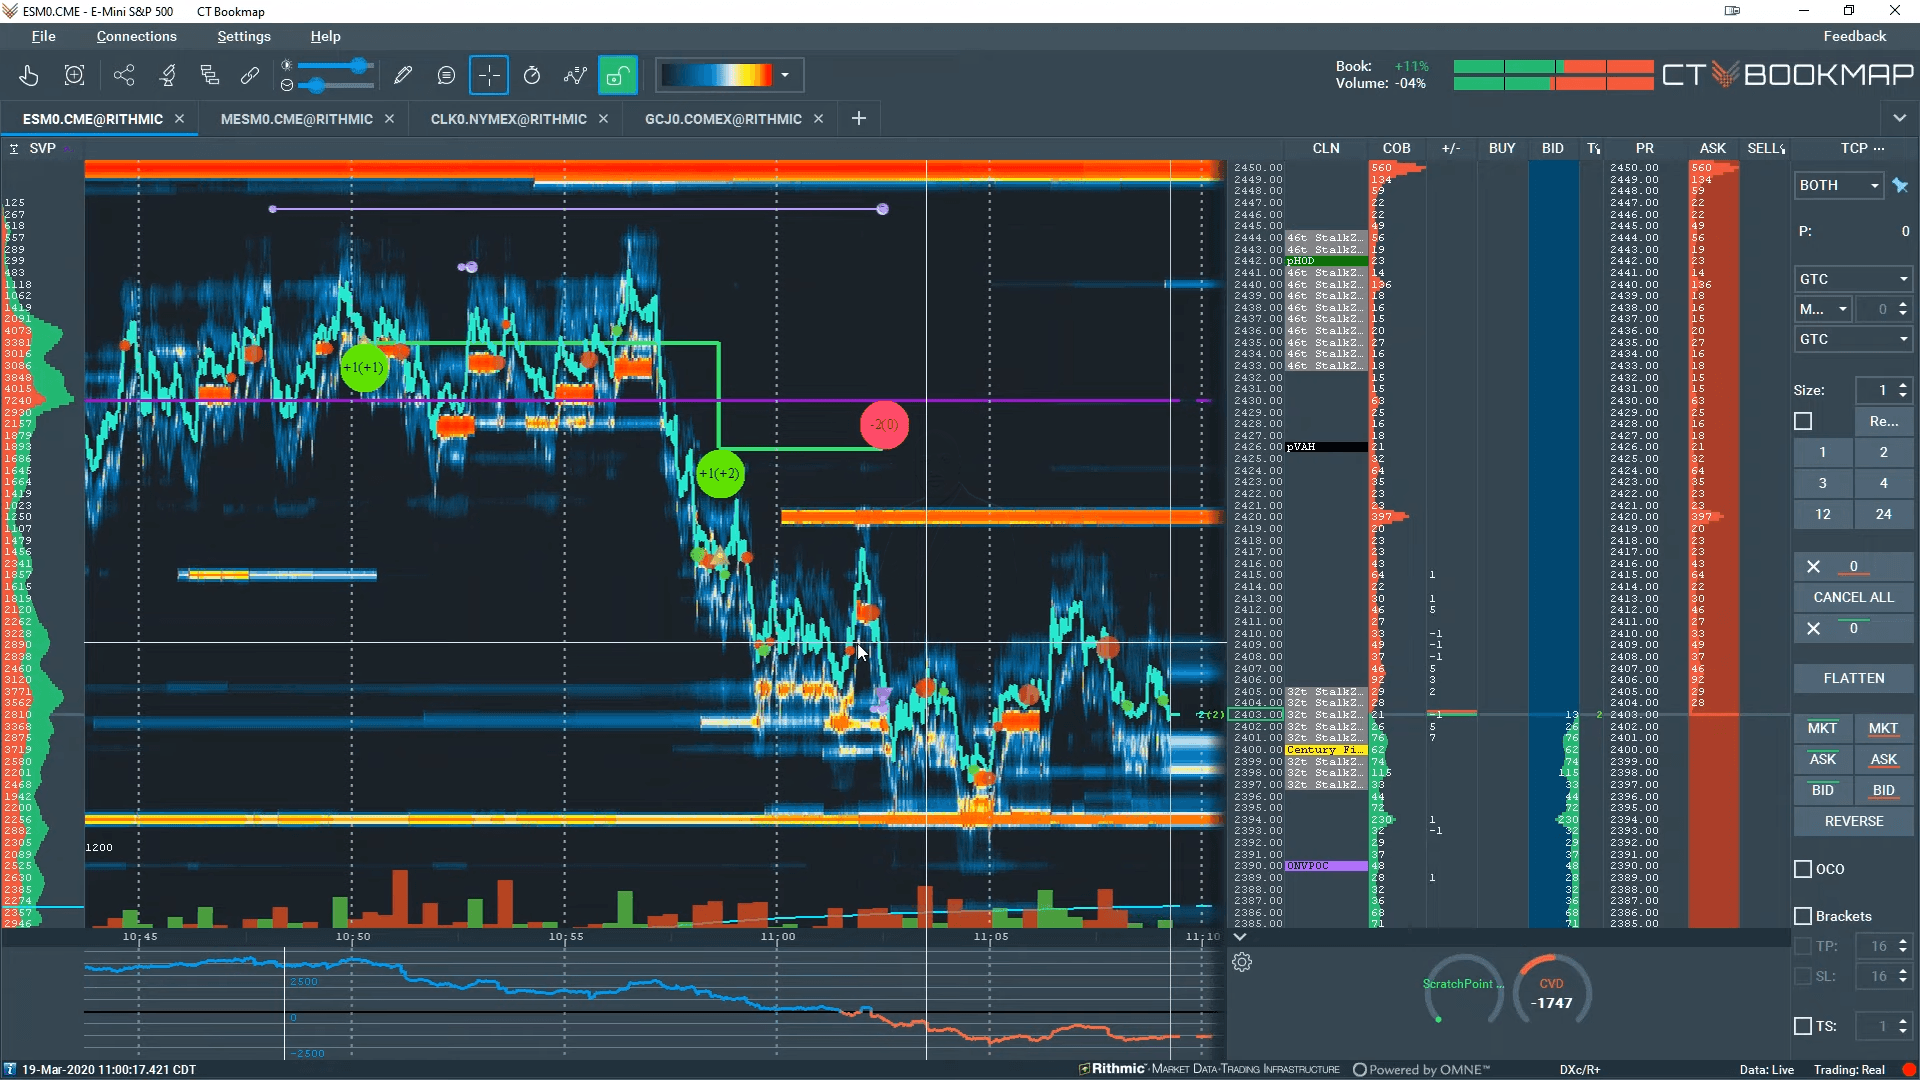
Unlike a standard DOM, Bookmap’s historical order book heatmap visually displays how the order book has changed over time. BookMap can help identify whether orders are real or not and can show you whether the market is in agreement with your homework levels. Never miss key order flow again. Check out BookMap today!
To view more available platforms provided by Edge Clear, please click here.
GET A 14-DAY TRIAL OF CT BOOKMAP
Request a BookMap Demo Powered by Rithmic
Track your risk with the ScratchPoint™ Indicator & Visualize executions with Volume Dots
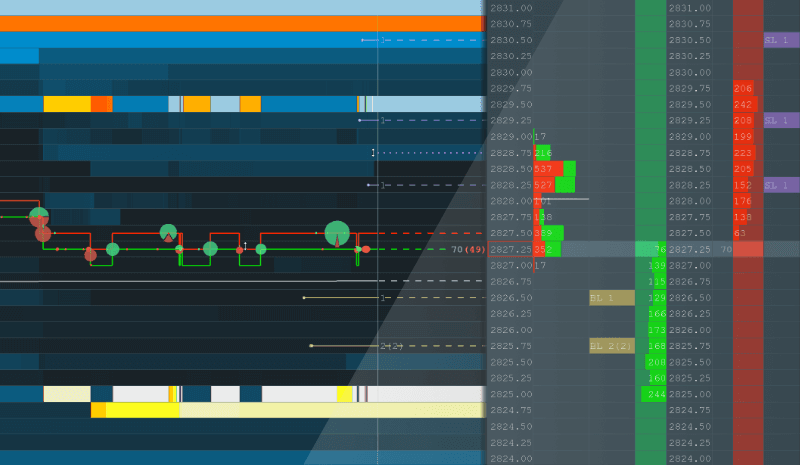
We believe you should always know where your risk point is. For this reason, Convergent Trading has developed the ScratchPoint™ Indicator. This is a dynamically updated line and indication on the heat-map that shows the price where you are profitable or are taking heat as well as how your break-even price is shifting as you add or take away from a trade.
Execute trades directly from Bookmap
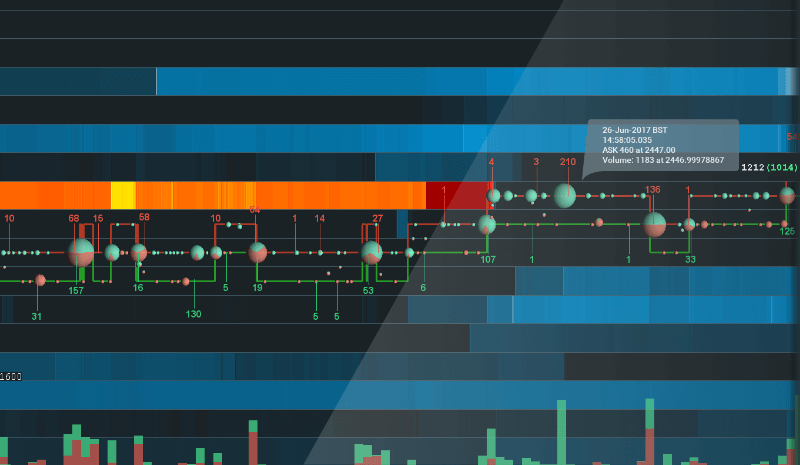
How a market trades relative to what is in the order book is often what tells the story. Volume Dots are filterable by size/trade size and can be clustered using a number of methods. With Volume Dots, Bookmap completes the order flow picture. When you’re intently focused on order flow, looking back and forth between different platforms can be problematic. Not an issue with Bookmap! You can trade via a traditional DOM and/or from the heatmap itself.
Market replay session
If you’ve set Bookmap to record live data and orders, you then have the ability to open a replay of the recorded session. Bookmap’s high performance market replay mode facilitates traders in their market review process by accurately replaying exactly what happened in that session.

Open an Account Today!
Start Today!