Experience precision, innovation, and customization with EdgeProX, the platform designed for traders who demand excellence.
Unleash the Power of Orderflow
Advanced Orderflow Tools
Navigate the markets with precision using our advanced charting and orderflow tools.
Gain a detailed view of market structure and liquidity, helping you pinpoint high-probability trading opportunities.
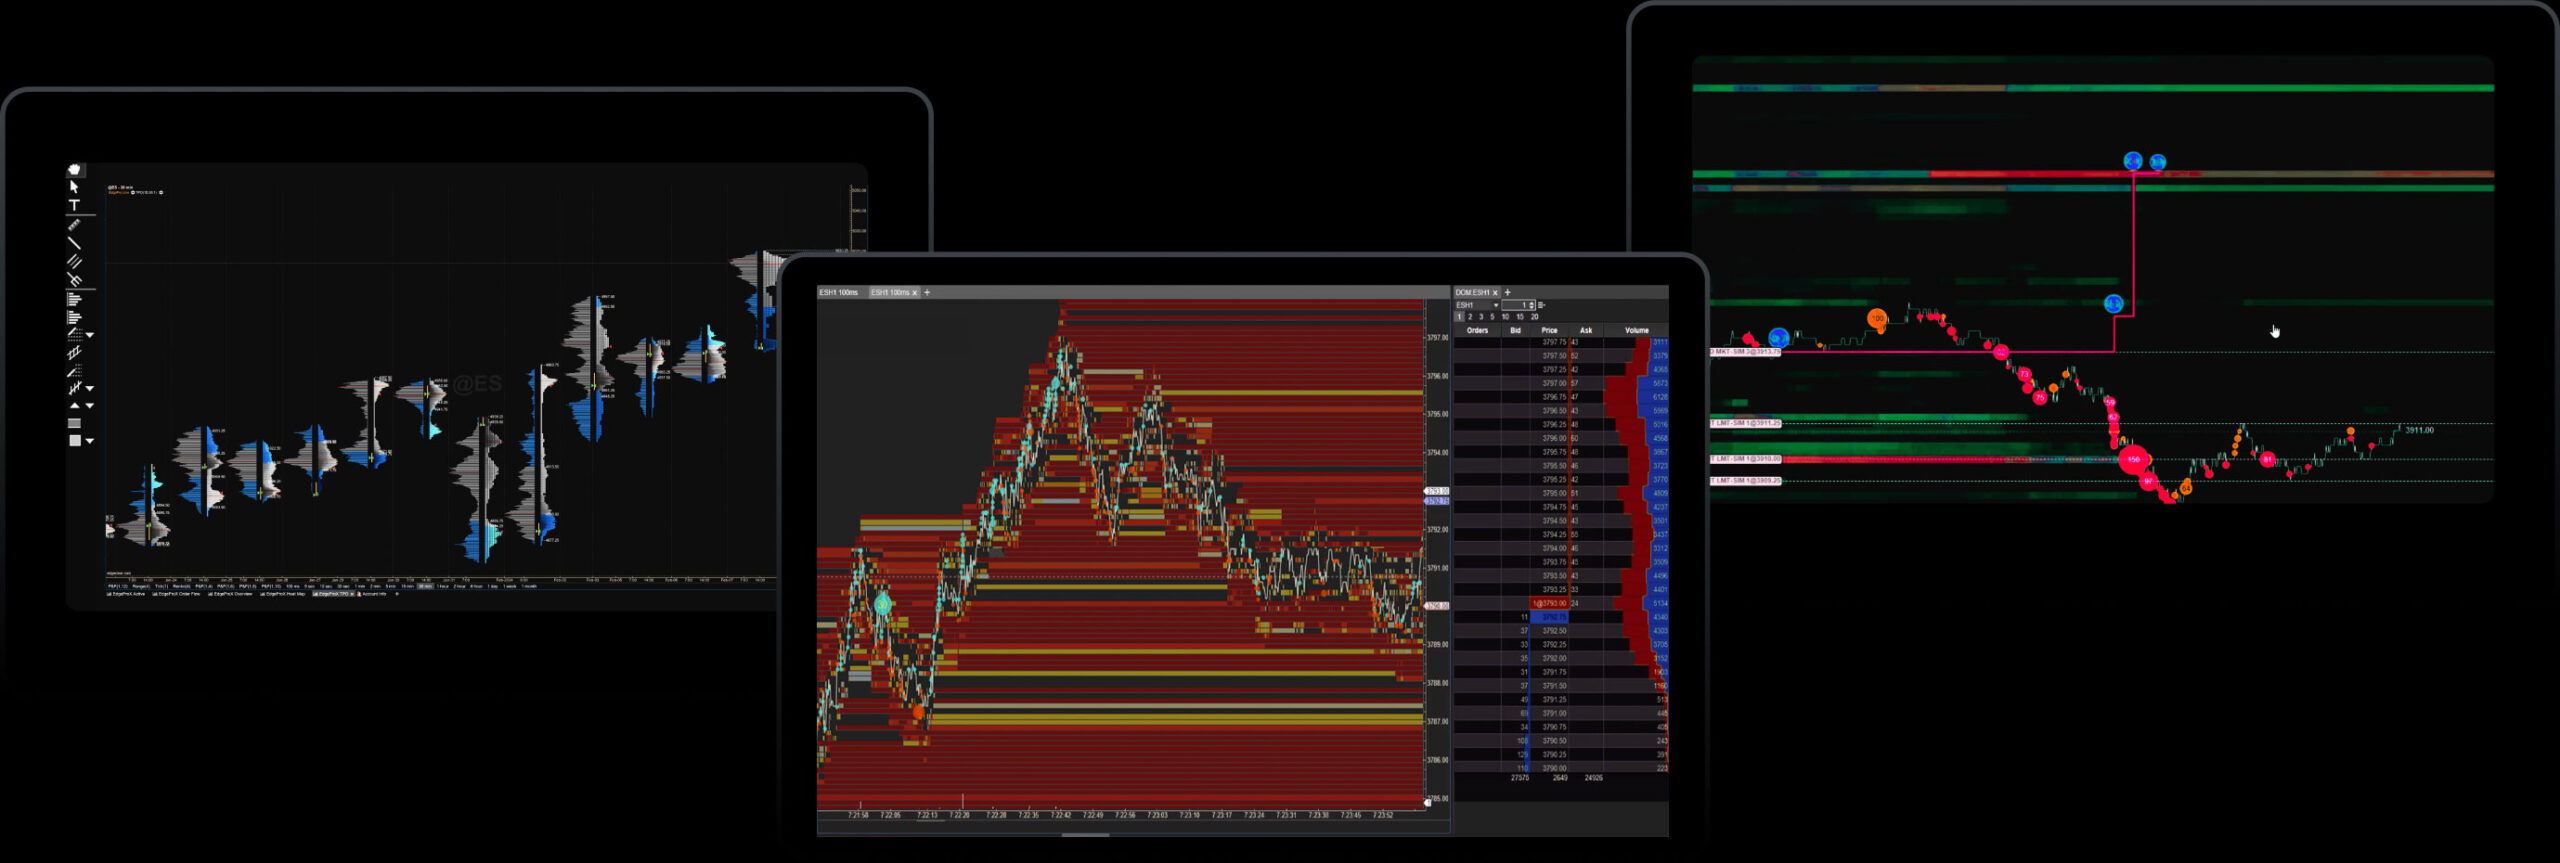
Footprint
Track volume at every price level, understand order flow, and make informed decisions based on real-time market activity.
Innovative Heat Maps
Identify liquidity pools, visualize order flow, and detect market patterns at a glance, ensuring you're always one step ahead.
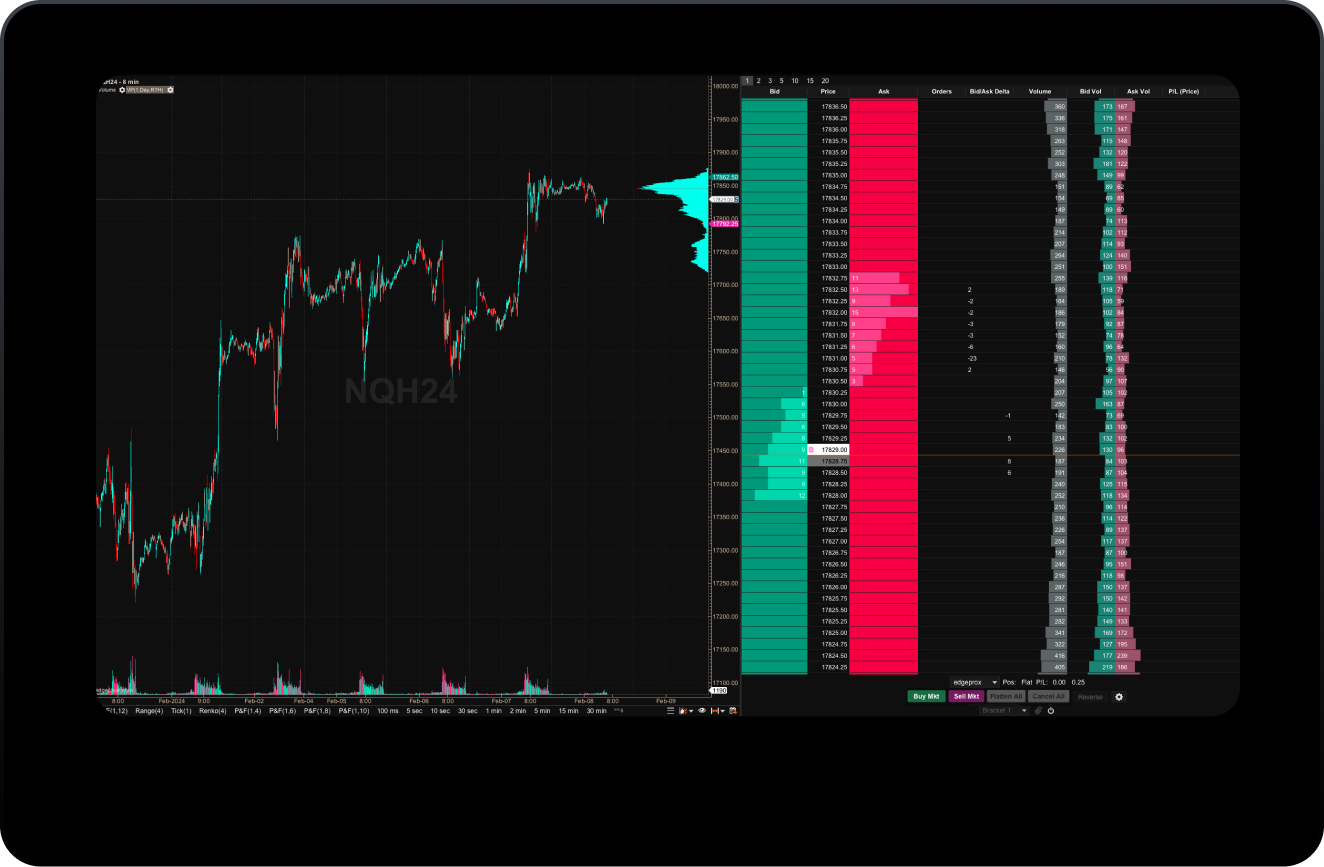
Advanced DOM
Monitor market depth, gauge market sentiment, and execute your trades with pinpoint accuracy.
Overlaying Indicators
Combine orderflow views to create a powerful new view of the market.
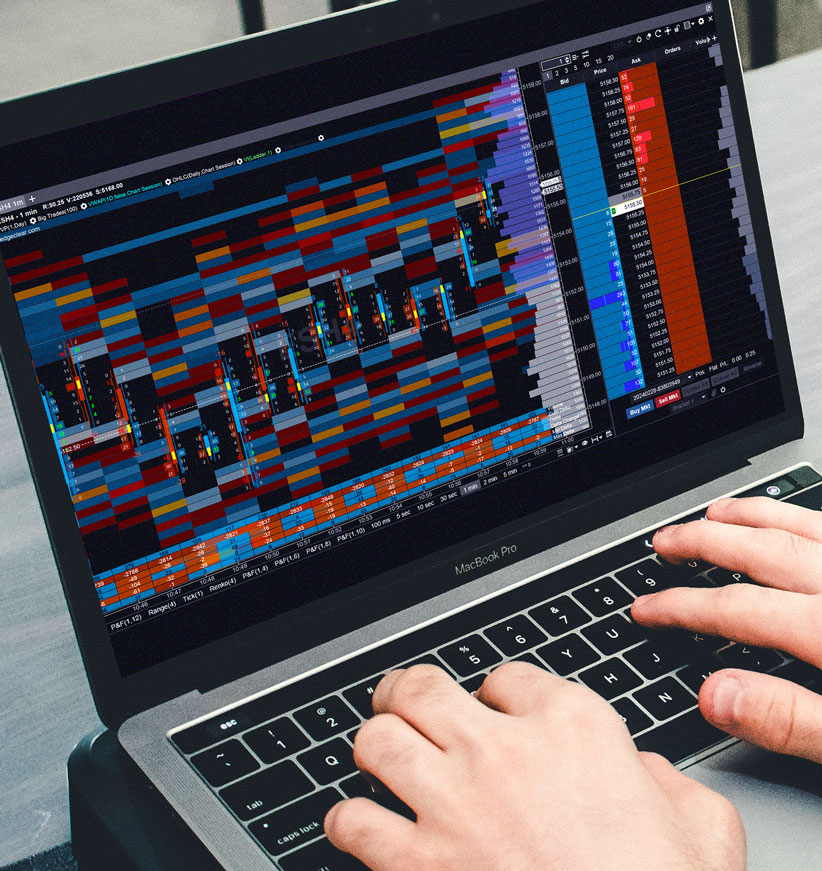
Advanced Charting and Analysis Tools
Complete Customization
Tailor Your Trading Environment - EdgeProX offers unique customization, allowing you to mold the platform to fit your unique trading style and preferences, enhancing both efficiency and effectiveness in your trading operations.
Alerts
Set custom alerts for price movements, indicators, or news, and stay informed wherever you are.
Interval customization
Adapt time frames and chart intervals to match their analysis and trading strategy precision.
Total DOM control
Fully customize depth-of-market views, ensuring a tailored trading experience that aligns with individual strategies and preferences.
Custom workspaces
Personalize your trading environment and the arrangement of tools, charts, and data, making it easier to focus on what's vital for informed decisions.
CTS and Rithmic Data
Ultra-low latency market data and order routing, delivering real-time insights and superior execution speed.
This high-quality data stream ensures traders can make informed decisions rapidly, optimizing their strategies for the best possible outcomes in dynamic markets.
This high-quality data stream ensures traders can make informed decisions rapidly, optimizing their strategies for the best possible outcomes in dynamic markets.
Learn More about CTS
Learn More about Rithmic
Refine your edge
Test your
trading strategy
Perfect your strategy with EdgeProX’s robust testing tools. Analyze, backtest, and refine your trading approach in a simulated environment to ensure you’re ready for the live markets.
Trade Simulation
A risk-free environment to test strategies, refine skills, and gain confidence. Experiment with various scenarios and understand market dynamics, ensuring you are better prepared for live trading.
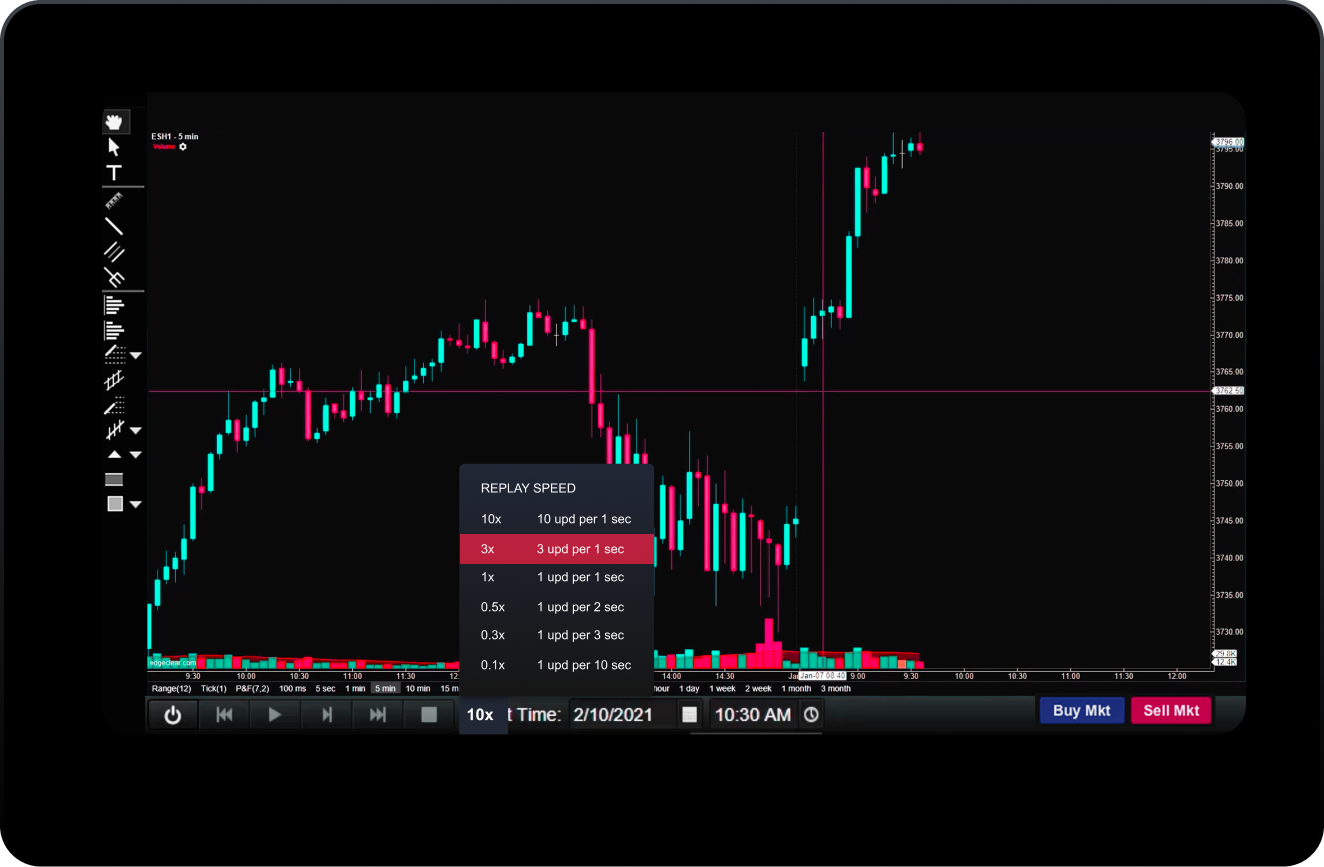
Bar Replay
Replay market data bar by bar, providing a detailed view of price movements and trading volume over time, enabling a deeper understanding of market trends and aiding in the refinement of trading strategies.


SIGN UP FOR JUST
$34.99 PER MONTH
TRADING FEATURES
- EdgePro Line
- Order Flow Heat Map
- Volume Imprint
- Advanced DOM
- Volume Profile Tools
- Market Profile TPO
- MBO Data Support
- One Data Feed per Workspace
- Cloud Workspaces
- Chart Tools
- 300+ Built-in Studies/Indicators
- Indicator on Indicator
- Java SDK
- Chart Templates and Chart Linking
- Non-Linear and Second-Based Bars
- Data Import/Export
- Repository
- Console Pages
- Timeframe Visibility Options
- Simple Price Alerts
- Replay Mode
- Trade Simulation
- Studies Pack
- Harmonic Tools Pack